本文實例講述了Python數據分析之雙色球中藍紅球分析統計。分享給大家供大家參考,具體如下:
這里接著上一篇Python數據分析之獲取雙色球歷史信息收集的數據處理下,
newdata.txt數據樣子
...
2005-08-21, 05,10,23,27,28,30,15
2005-08-18, 04,05,17,18,26,33,04
2005-08-16, 09,12,18,21,28,29,05
...
一、藍球統計:
analyze_data_lan.py
#!/usr/bin/python# -*- coding:UTF-8 -*-#調用pandas numpy matplotlib包import pandas as pdimport numpy as npimport matplotlib.pyplot as plt#讀取newdata.txt文件df = pd.read_table('newdata.txt',header=None,sep=',')# print df# print df[1:3] #第2到第3行(索引0開始為第一行,1代表第二行,不包含第四行)# print df.loc[0:10,:] #第1行到第9行的全部列# print df.loc[:,[0,7]] #全部行的第1和第8列tdate = sorted(df.loc[:,0]) #取第一列數據# print tdatetdate1 = [] #將tdate數據讀取到列表中for i in tdate: tdate1.append(i)print tdate1# s = pd.Series(tdate1, index=tdate1)s = pd.Series(range(1,len(tdate1)+1), index=tdate1) #將日期轉換為對應的數值從1開始# print stblue = list(reversed(df.loc[:,7])) #對數據取反print tbluefenzu = pd.value_counts(tblue,ascending=False) #將數據進行分組統計,按照統計數降序排序print fenzux=list(fenzu.index[:]) #獲取藍色號碼y=list(fenzu.values[:]) #獲得藍色統計數量print xprint y# print type(fenzu)plt.figure(figsize=(10,6),dpi=70) #配置畫圖大小、和細度plt.legend(loc='best')# plt.plot(fenzu,color='red') #線圖plt.bar(x,y,alpha=.5, color='b',width=0.8) #直方圖參數設置plt.title('The blue ball number') #標題plt.xlabel('blue number') #x軸內容plt.ylabel('times') #y軸內容plt.show() #顯示圖結果輸出:
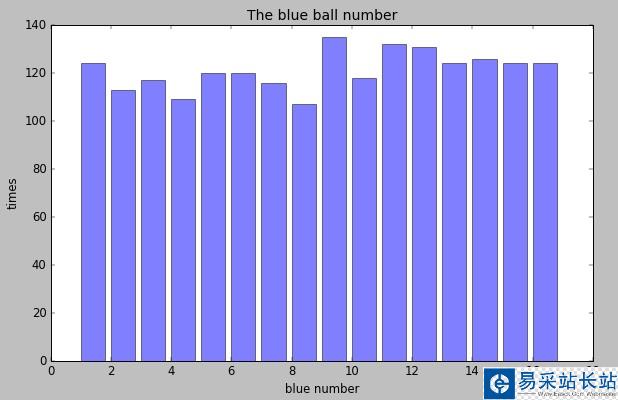
看來藍球9選中最多
二、紅球統計
analyze_data_hong.py
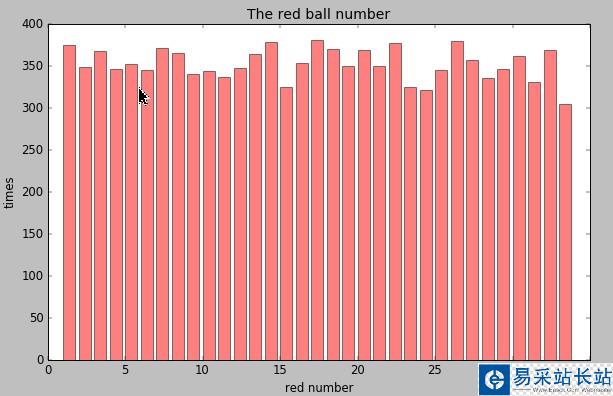
#!/usr/bin/python# -*- coding:UTF-8 -*-import pandas as pdimport numpy as npimport matplotlib.pyplot as plt#讀取文件df = pd.read_table('newdata.txt',header=None,sep=',')# print df# print df[1:3]# print df.loc[0:10,:]# print df.loc[:,1:6]tdate = sorted(df.loc[:,0])# print tdateh1 = df.loc[:,1]h2 = df.loc[:,2]h3 = df.loc[:,3]h4 = df.loc[:,4]h5 = df.loc[:,5]h6 = df.loc[:,6]#將數據合并到一起all = h1.append(h2).append(h3).append(h4).append(h5).append(h6)alldata = list(all)print len(alldata)fenzu = pd.value_counts(all,ascending=False)print fenzux=list(fenzu.index[:])y=list(fenzu.values[:])print xprint y# print type(fenzu)plt.figure(figsize=(10,6),dpi=70)plt.legend(loc='best',)# plt.plot(fenzu,color='red')plt.bar(x,y,alpha=.5, color='r',width=0.8)plt.title('The red ball number')plt.xlabel('red number')plt.ylabel('times')plt.show()結果輸出:
新聞熱點


疑難解答