本文主要是關于matplotlib的一些基本用法。
Demo
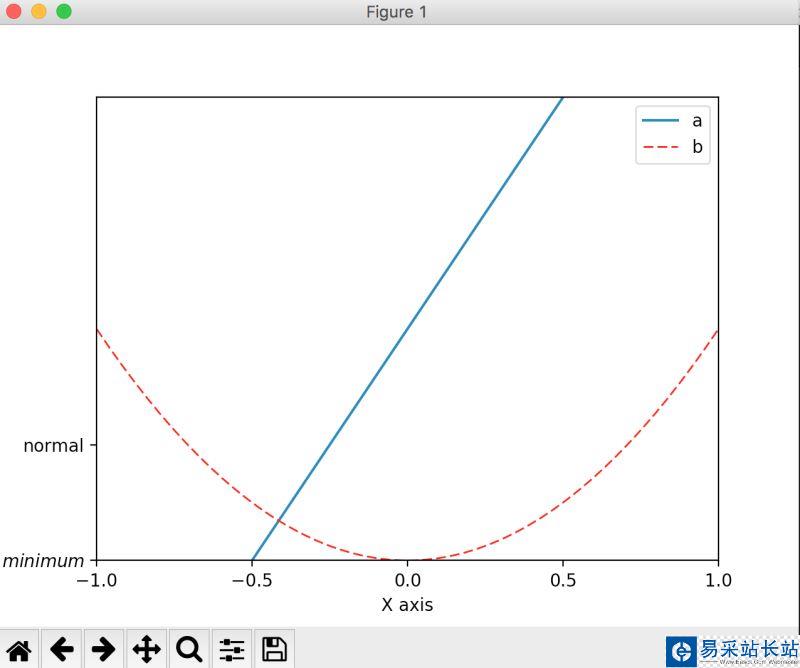
import matplotlib.pyplot as pltimport numpy as np# 繪制普通圖像x = np.linspace(-1, 1, 50)y1 = 2 * x + 1y2 = x**2plt.figure()# 在繪制時設置lable, 逗號是必須的l1, = plt.plot(x, y1, label = 'line')l2, = plt.plot(x, y2, label = 'parabola', color = 'red', linewidth = 1.0, linestyle = '--')# 設置坐標軸的取值范圍plt.xlim((-1, 1))plt.ylim((0, 2))# 設置坐標軸的lableplt.xlabel('X axis')plt.ylabel('Y axis')# 設置x坐標軸刻度, 原來為0.25, 修改后為0.5plt.xticks(np.linspace(-1, 1, 5))# 設置y坐標軸刻度及標簽, $$是設置字體plt.yticks([0, 0.5], ['$minimum$', 'normal'])# 設置legendplt.legend(handles = [l1, l2,], labels = ['a', 'b'], loc = 'best')plt.show()結果展示:
總結
以上就是本文關于matplotlib設置legend圖例代碼示例的全部內容,希望對大家有所幫助。感興趣的朋友可以繼續參閱本站其他相關專題,如有不足之處,歡迎留言指出。感謝朋友們對本站的支持!
新聞熱點


疑難解答


