有關pygal的介紹和安裝,大家可以參閱《pip和pygal的安裝實例教程》,然后利用pygal實現畫世界地圖。代碼如下:
#coding=utf-8 import json import pygal.maps.world #Pygal樣式保存在模塊style中,包括RotateStyle調整顏色和LightColorizedStyle加亮顏色 #也可以寫成from pygal.style import LightColorizedStyle, RotateStyle import pygal.style from country_codes import get_country_code #將數據加載到列表中 filename='population_data.json' with open(filename) as f: pop_data=json.load(f) #創建一個包含人口數量的字典 cc_populations={} for pop_dict in pop_data: if pop_dict['Year'][:4]=='2010': country_name=pop_dict['Country Name'] poplulation=int(pop_dict['Value']) code=get_country_code(country_name) if code: cc_populations[code]=poplulation #根據人口數量分組 cc_pops_1,cc_pops_2,cc_pops_3={},{},{} for cc,pop in cc_populations.items(): if pop < 10000000: cc_pops_1[cc] = pop elif pop < 1000000000: cc_pops_2[cc] = pop else: cc_pops_3[cc] = pop print len(cc_pops_1),len(cc_pops_2),len(cc_pops_3) #畫圖 #wm_style是一個樣式對象,第一個實參表示顏色,十六進制格式,分別表示紅綠藍的分量(RGB),第二個實參表示加亮顏色主題 wm_style=pygal.style.RotateStyle('#3399AA',base_style=pygal.style.LightColorizedStyle) wm=pygal.maps.world.World(style=wm_style) wm.title="World Population in 2010,by Country" #add接收一個標簽和一個列表,此例中標簽為人口數量區間,列表是國家和人口數量的列表 wm.add('0-10m',cc_pops_1) wm.add('10m-1bn',cc_pops_2) wm.add('>1bn',cc_pops_3) wm.render_to_file('world_population.svg') 注意:
1.有些書上寫的國別碼是在pygal.i18n中的COUNTRIES,我importpygal.i18n會報錯,改為pygal.maps.world模塊成功
from pygal.maps.world import COUNTRIES
或者使用如下方式,不是很明白這兩種有什么區別,都運行正常
from pygal_maps_world.i18n import COUNTRIE
2.pygal提供的圖標類型WorldMap我也沒找到,創建實例wm=pygal.WorlgMap()報錯,改為
wm=pygal.maps.world.World()
3.wm_style是一個樣式對象,用來展示圖的顏色和亮度等,LightColorizedStyle和RotateStyle
但是只使用LightColorizedStyle,無法控制使用的顏色,pygal會選擇默認基色。(效果如圖1)
wm_style=pygal.style.LightColorizedStyle
設置自己喜歡的顏色,也可以不寫base_style(效果如圖2,my_style如下)
wm_style=pygal.style.RotateStyle('#3399AA',base_style=pygal.style.LightColorizedStyle) 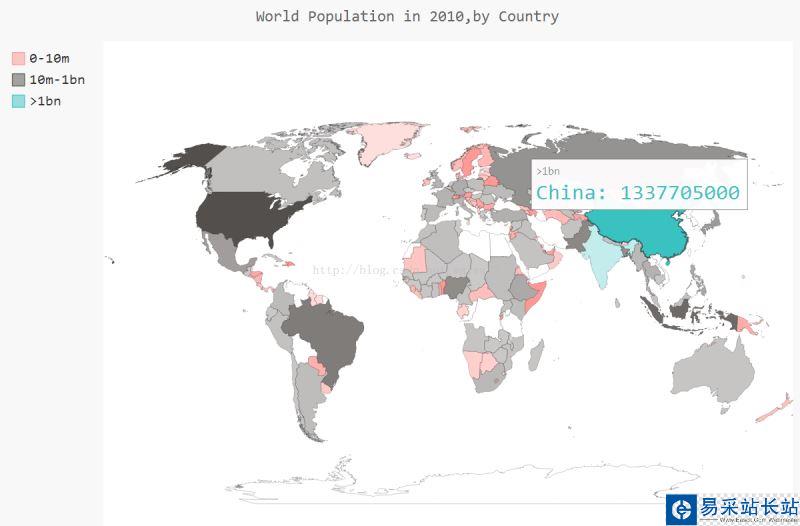
新聞熱點


疑難解答


