用python進(jìn)行線性回歸分析非常方便,有現(xiàn)成的庫可以使用比如:numpy.linalog.lstsq例子、scipy.stats.linregress例子、pandas.ols例子等。
不過本文使用sklearn庫的linear_model.LinearRegression,支持任意維度,非常好用。
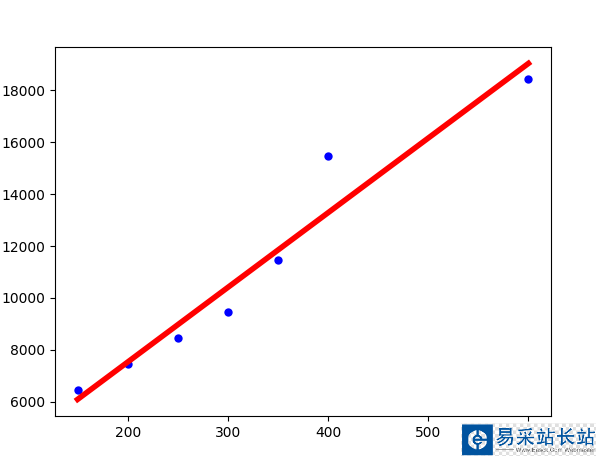
一、二維直線的例子
預(yù)備知識:線性方程y=a∗x+b。y=a∗x+b表示平面一直線
下面的例子中,我們根據(jù)房屋面積、房屋價格的歷史數(shù)據(jù),建立線性回歸模型。
然后,根據(jù)給出的房屋面積,來預(yù)測房屋價格。這里是數(shù)據(jù)來源
import pandas as pd from io import StringIO from sklearn import linear_model import matplotlib.pyplot as plt # 房屋面積與價格歷史數(shù)據(jù)(csv文件) csv_data = 'square_feet,price/n150,6450/n200,7450/n250,8450/n300,9450/n350,11450/n400,15450/n600,18450/n' # 讀入dataframe df = pd.read_csv(StringIO(csv_data)) print(df) # 建立線性回歸模型 regr = linear_model.LinearRegression() # 擬合 regr.fit(df['square_feet'].reshape(-1, 1), df['price']) # 注意此處.reshape(-1, 1),因為X是一維的! # 不難得到直線的斜率、截距 a, b = regr.coef_, regr.intercept_ # 給出待預(yù)測面積 area = 238.5 # 方式1:根據(jù)直線方程計算的價格 print(a * area + b) # 方式2:根據(jù)predict方法預(yù)測的價格 print(regr.predict(area)) # 畫圖 # 1.真實的點 plt.scatter(df['square_feet'], df['price'], color='blue') # 2.擬合的直線 plt.plot(df['square_feet'], regr.predict(df['square_feet'].reshape(-1,1)), color='red', linewidth=4) plt.show()
二、三維平面的例子
預(yù)備知識:線性方程z=a∗x+b∗y+c。z=a∗x+b∗y+c 表示空間一平面
由于找不到真實數(shù)據(jù),只好自己虛擬一組數(shù)據(jù)。
import numpy as np from sklearn import linear_model from mpl_toolkits.mplot3d import Axes3D import matplotlib.pyplot as plt xx, yy = np.meshgrid(np.linspace(0,10,10), np.linspace(0,100,10)) zz = 1.0 * xx + 3.5 * yy + np.random.randint(0,100,(10,10)) # 構(gòu)建成特征、值的形式 X, Z = np.column_stack((xx.flatten(),yy.flatten())), zz.flatten() # 建立線性回歸模型 regr = linear_model.LinearRegression() # 擬合 regr.fit(X, Z) # 不難得到平面的系數(shù)、截距 a, b = regr.coef_, regr.intercept_ # 給出待預(yù)測的一個特征 x = np.array([[5.8, 78.3]]) # 方式1:根據(jù)線性方程計算待預(yù)測的特征x對應(yīng)的值z(注意:np.sum) print(np.sum(a * x) + b) # 方式2:根據(jù)predict方法預(yù)測的值z print(regr.predict(x)) # 畫圖 fig = plt.figure() ax = fig.gca(projection='3d') # 1.畫出真實的點 ax.scatter(xx, yy, zz) # 2.畫出擬合的平面 ax.plot_wireframe(xx, yy, regr.predict(X).reshape(10,10)) ax.plot_surface(xx, yy, regr.predict(X).reshape(10,10), alpha=0.3) plt.show()
新聞熱點


疑難解答


