Python畫圖主要用到matplotlib這個庫。Matplotlib 是一個 Python 的 2D繪圖庫,它以各種硬拷貝格式和跨平臺的交互式環境生成出版質量級別的圖形。
這里有一本電子書供大家參考:《Python圖表繪制:matplotlib繪圖庫入門》
具體來說是pylab和pyplot這兩個子庫。這兩個庫可以滿足基本的畫圖需求,而條形圖,散點圖等特殊圖,下面再單獨具體介紹。
首先給出pylab神器鎮文:pylab.rcParams.update(params)。這個函數幾乎可以調節圖的一切屬性,包括但不限于:坐標范圍,axes標簽字號大小,xtick,ytick標簽字號,圖線寬,legend字號等。
具體參數參看官方文檔:http://matplotlib.org/users/customizing.html
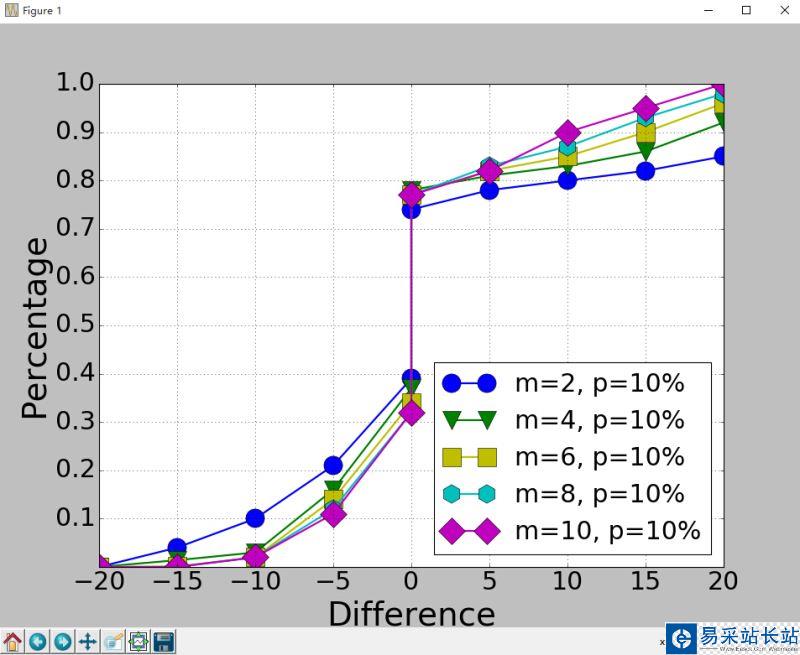
首先給出一個Python3畫圖的例子。
import matplotlib.pyplot as pltimport matplotlib.pylab as pylabimport scipy.ioimport numpy as npparams={ 'axes.labelsize': '35', 'xtick.labelsize':'27', 'ytick.labelsize':'27', 'lines.linewidth':2 , 'legend.fontsize': '27', 'figure.figsize' : '12, 9' # set figure size}pylab.rcParams.update(params) #set figure parameter#line_styles=['ro-','b^-','gs-','ro--','b^--','gs--'] #set line style #We give the coordinate date directly to give an example.x1 = [-20,-15,-10,-5,0,0,5,10,15,20]y1 = [0,0.04,0.1,0.21,0.39,0.74,0.78,0.80,0.82,0.85]y2 = [0,0.014,0.03,0.16,0.37,0.78,0.81,0.83,0.86,0.92]y3 = [0,0.001,0.02,0.14,0.34,0.77,0.82,0.85,0.90,0.96]y4 = [0,0,0.02,0.12,0.32,0.77,0.83,0.87,0.93,0.98]y5 = [0,0,0.02,0.11,0.32,0.77,0.82,0.90,0.95,1] plt.plot(x1,y1,'bo-',label='m=2, p=10%',markersize=20) # in 'bo-', b is blue, o is O marker, - is solid line and so onplt.plot(x1,y2,'gv-',label='m=4, p=10%',markersize=20)plt.plot(x1,y3,'ys-',label='m=6, p=10%',markersize=20)plt.plot(x1,y4,'ch-',label='m=8, p=10%',markersize=20)plt.plot(x1,y5,'mD-',label='m=10, p=10%',markersize=20) fig1 = plt.figure(1)axes = plt.subplot(111) #axes = plt.gca()axes.set_yticks([0.1,0.2,0.3,0.4,0.5,0.6,0.7,0.8,0.9,1.0])axes.grid(True) # add grid plt.legend(loc="lower right") #set legend locationplt.ylabel('Percentage') # set ystick labelplt.xlabel('Difference') # set xstck label plt.savefig('D://commonNeighbors_CDF_snapshots.eps',dpi = 1000,bbox_inches='tight')plt.show()顯示效果如下:
代碼沒什么好說的,這里只說一下plt.subplot(111)這個函數。
plt.subplot(111)和plt.subplot(1,1,1)是等價的。意思是將區域分成1行1列,當前畫的是第一個圖(排序由行至列)。
plt.subplot(211)意思就是將區域分成2行1列,當前畫的是第一個圖(第一行,第一列)。以此類推,只要不超過10,逗號就可省去。
python畫條形圖。代碼如下。
import scipy.ioimport numpy as npimport matplotlib.pylab as pylabimport matplotlib.pyplot as pltimport matplotlib.ticker as mtickparams={ 'axes.labelsize': '35', 'xtick.labelsize':'27', 'ytick.labelsize':'27', 'lines.linewidth':2 , 'legend.fontsize': '27', 'figure.figsize' : '24, 9'}pylab.rcParams.update(params)y1 = [9.79,7.25,7.24,4.78,4.20]y2 = [5.88,4.55,4.25,3.78,3.92]y3 = [4.69,4.04,3.84,3.85,4.0]y4 = [4.45,3.96,3.82,3.80,3.79]y5 = [3.82,3.89,3.89,3.78,3.77]ind = np.arange(5) # the x locations for the groupswidth = 0.15plt.bar(ind,y1,width,color = 'blue',label = 'm=2') plt.bar(ind+width,y2,width,color = 'g',label = 'm=4') # ind+width adjusts the left start location of the bar.plt.bar(ind+2*width,y3,width,color = 'c',label = 'm=6')plt.bar(ind+3*width,y4,width,color = 'r',label = 'm=8')plt.bar(ind+4*width,y5,width,color = 'm',label = 'm=10')plt.xticks(np.arange(5) + 2.5*width, ('10%','15%','20%','25%','30%'))plt.xlabel('Sample percentage')plt.ylabel('Error rate')fmt = '%.0f%%' # Format you want the ticks, e.g. '40%'xticks = mtick.FormatStrFormatter(fmt) # Set the formatteraxes = plt.gca() # get current axesaxes.yaxis.set_major_formatter(xticks) # set % format to ystick.axes.grid(True)plt.legend(loc="upper right")plt.savefig('D://errorRate.eps', format='eps',dpi = 1000,bbox_inches='tight')plt.show()
新聞熱點


疑難解答


