最近開始學習Python編程,遇到scatter函數,感覺里面的參數不知道什么意思于是查資料,最后總結如下:
1、scatter函數原型
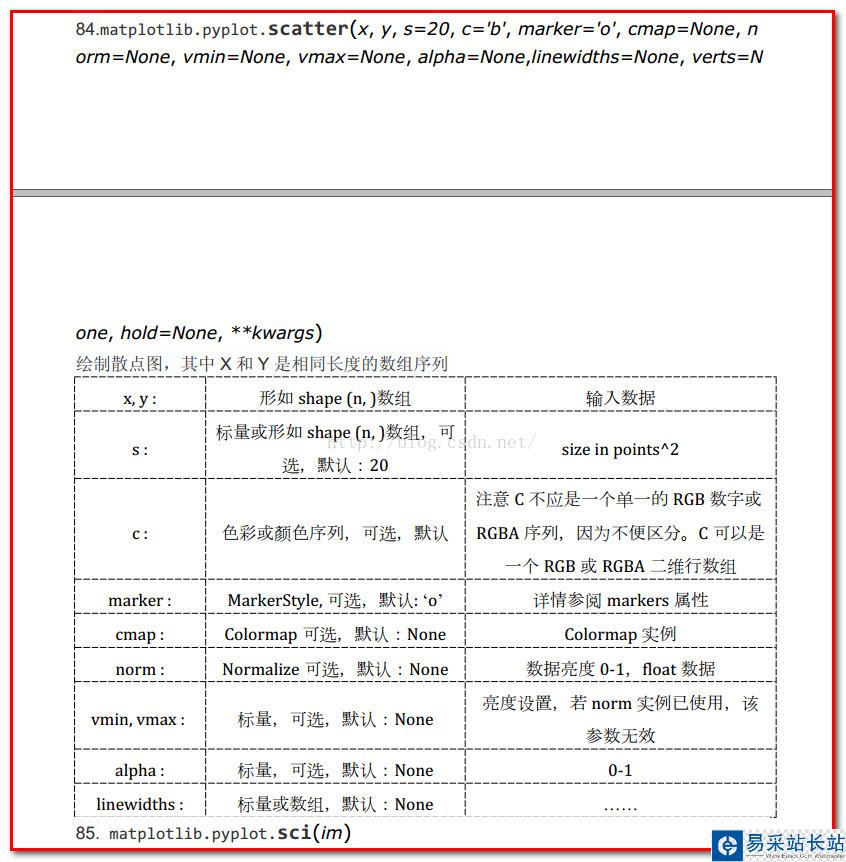
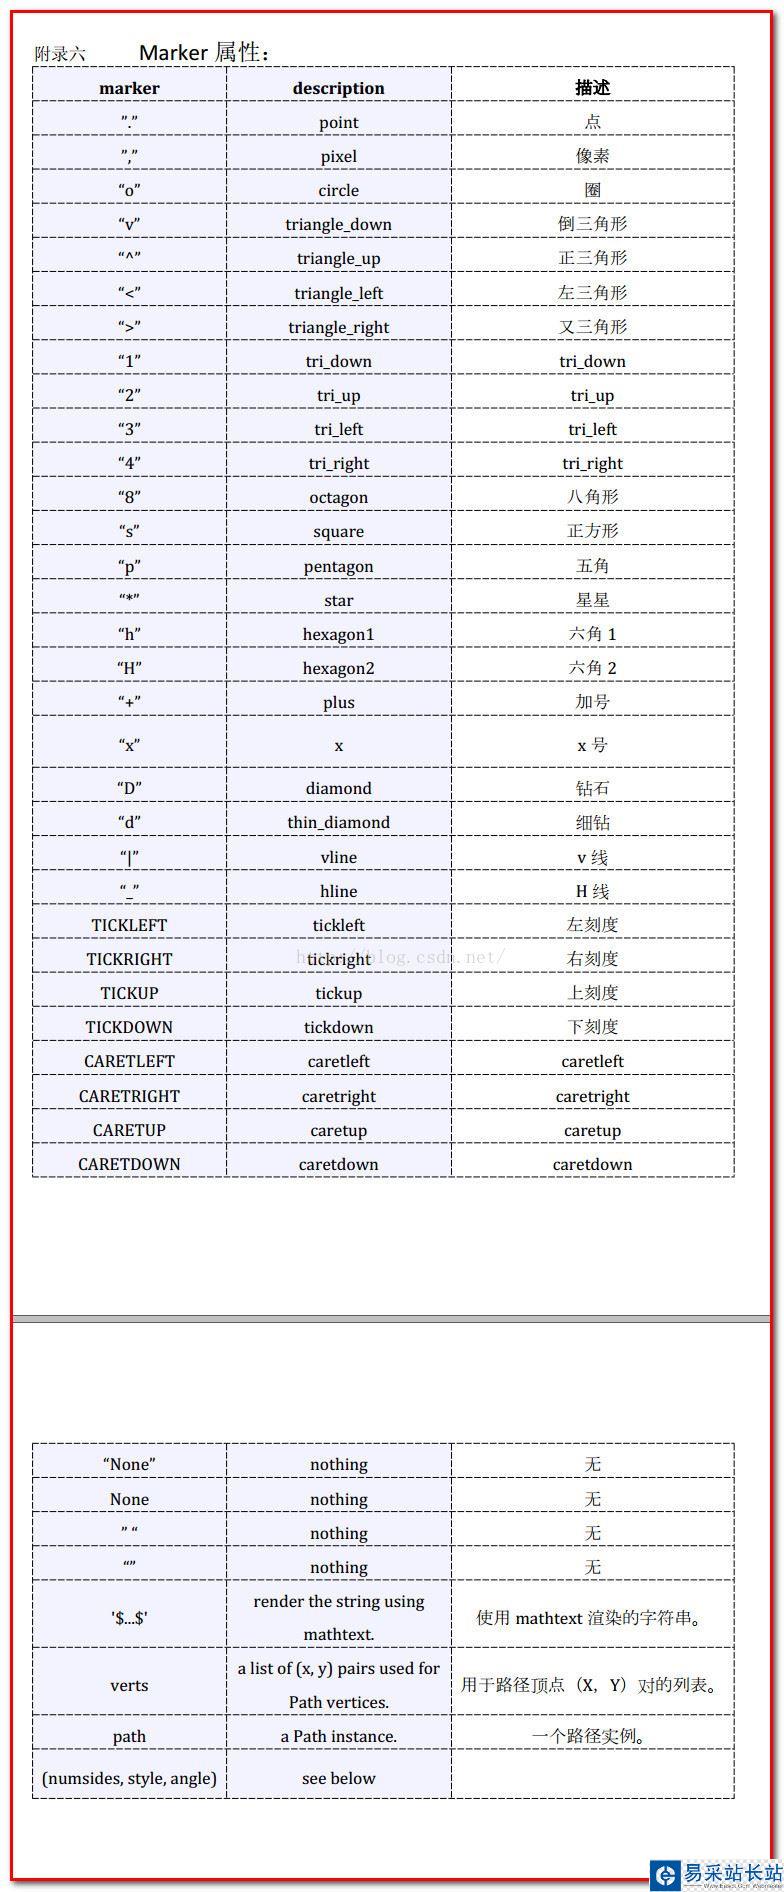
2、其中散點的形狀參數marker如下:
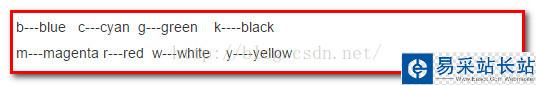
3、其中顏色參數c如下:
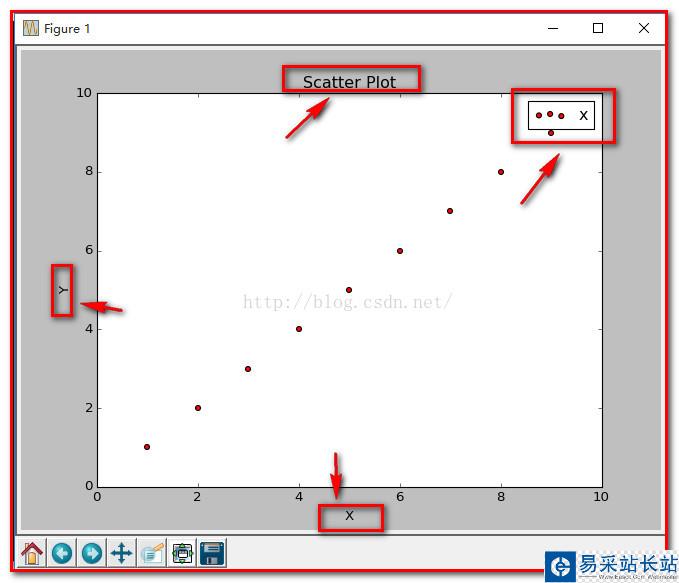
4、基本的使用方法如下:
#導入必要的模塊 import numpy as np import matplotlib.pyplot as plt #產生測試數據 x = np.arange(1,10) y = x fig = plt.figure() ax1 = fig.add_subplot(111) #設置標題 ax1.set_title('Scatter Plot') #設置X軸標簽 plt.xlabel('X') #設置Y軸標簽 plt.ylabel('Y') #畫散點圖 ax1.scatter(x,y,c = 'r',marker = 'o') #設置圖標 plt.legend('x1') #顯示所畫的圖 plt.show() 結果如下:
5、當scatter后面參數中數組的使用方法,如s,當s是同x大小的數組,表示x中的每個點對應s中一個大小,其他如c,等用法一樣,如下:
(1)、不同大小
#導入必要的模塊 import numpy as np import matplotlib.pyplot as plt #產生測試數據 x = np.arange(1,10) y = x fig = plt.figure() ax1 = fig.add_subplot(111) #設置標題 ax1.set_title('Scatter Plot') #設置X軸標簽 plt.xlabel('X') #設置Y軸標簽 plt.ylabel('Y') #畫散點圖 sValue = x*10 ax1.scatter(x,y,s=sValue,c='r',marker='x') #設置圖標 plt.legend('x1') #顯示所畫的圖 plt.show() 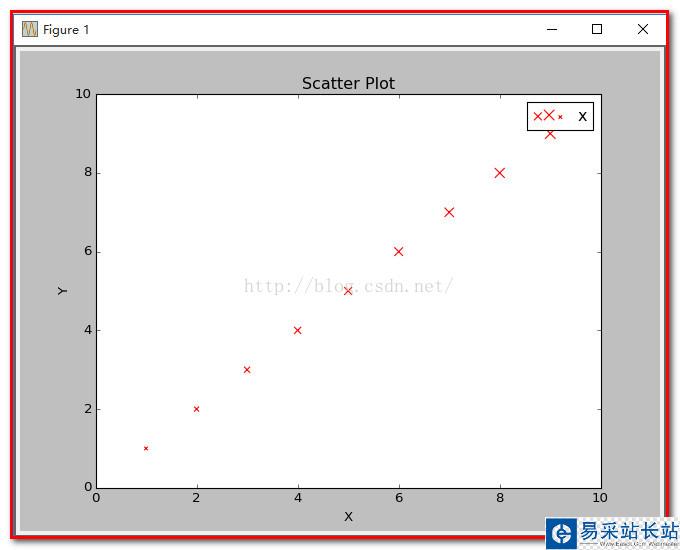
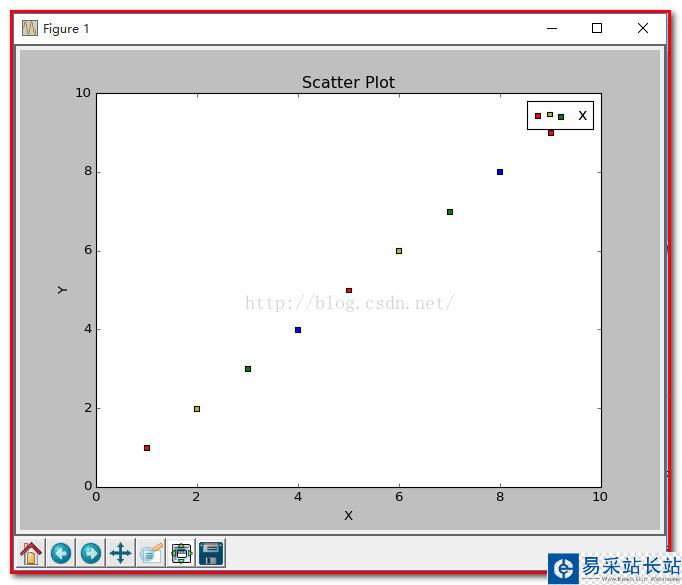
(2)、不同顏色
#導入必要的模塊 import numpy as np import matplotlib.pyplot as plt #產生測試數據 x = np.arange(1,10) y = x fig = plt.figure() ax1 = fig.add_subplot(111) #設置標題 ax1.set_title('Scatter Plot') #設置X軸標簽 plt.xlabel('X') #設置Y軸標簽 plt.ylabel('Y') #畫散點圖 cValue = ['r','y','g','b','r','y','g','b','r'] ax1.scatter(x,y,c=cValue,marker='s') #設置圖標 plt.legend('x1') #顯示所畫的圖 plt.show() 結果:
(3)、線寬linewidths
#導入必要的模塊 import numpy as np import matplotlib.pyplot as plt #產生測試數據 x = np.arange(1,10) y = x fig = plt.figure() ax1 = fig.add_subplot(111) #設置標題 ax1.set_title('Scatter Plot') #設置X軸標簽 plt.xlabel('X') #設置Y軸標簽 plt.ylabel('Y') #畫散點圖 lValue = x ax1.scatter(x,y,c='r',s= 100,linewidths=lValue,marker='o') #設置圖標 plt.legend('x1') #顯示所畫的圖 plt.show() 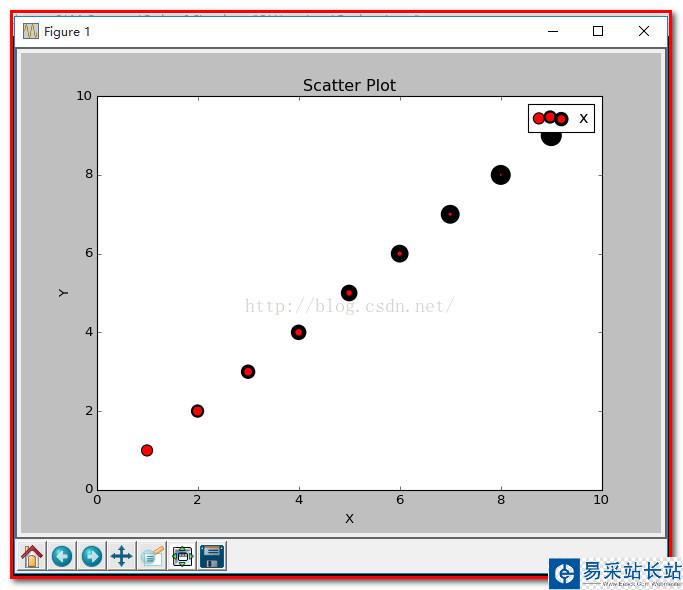
注: 這就是scatter基本的用法。
PS:下面舉個示例
新聞熱點


疑難解答


