看這篇文章前強(qiáng)烈建議你看看上一篇python實(shí)現(xiàn)梯度下降法:
一、為什么要提出隨機(jī)梯度下降算法
注意看梯度下降法權(quán)值的更新方式(推導(dǎo)過程在上一篇文章中有)
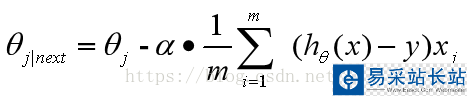
也就是說每次更新權(quán)值 都需要遍歷整個數(shù)據(jù)集(注意那個求和符號),當(dāng)數(shù)據(jù)量小的時候,我們還能夠接受這種算法,一旦數(shù)據(jù)量過大,那么使用該方法會使得收斂過程極度緩慢,并且當(dāng)存在多個局部極小值時,無法保證搜索到全局最優(yōu)解。為了解決這樣的問題,引入了梯度下降法的進(jìn)階形式:隨機(jī)梯度下降法。
二、核心思想
對于權(quán)值的更新不再通過遍歷全部的數(shù)據(jù)集,而是選擇其中的一個樣本即可(對于程序員來說你的第一反應(yīng)一定是:在這里需要一個隨機(jī)函數(shù)來選擇一個樣本,不是嗎?),一般來說其步長的選擇比梯度下降法的步長要小一點(diǎn),因?yàn)樘荻认陆捣ㄊ褂玫氖菧?zhǔn)確梯度,所以它可以朝著全局最優(yōu)解(當(dāng)問題為凸問題時)較大幅度的迭代下去,但是隨機(jī)梯度法不行,因?yàn)樗褂玫氖墙铺荻龋蛘邔τ谌謥碚f有時候它走的也許根本不是梯度下降的方向,故而它走的比較緩,同樣這樣帶來的好處就是相比于梯度下降法,它不是那么容易陷入到局部最優(yōu)解中去。
三、權(quán)值更新方式
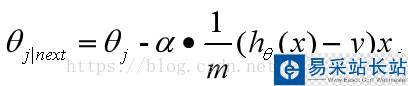
(i表示樣本標(biāo)號下標(biāo),j表示樣本維數(shù)下標(biāo))
四、代碼實(shí)現(xiàn)(大體與梯度下降法相同,不同在于while循環(huán)中的內(nèi)容)
import numpy as npimport matplotlib.pyplot as pltfrom mpl_toolkits.mplot3d import axes3dfrom matplotlib import style #構(gòu)造數(shù)據(jù)def get_data(sample_num=1000): """ 擬合函數(shù)為 y = 5*x1 + 7*x2 :return: """ x1 = np.linspace(0, 9, sample_num) x2 = np.linspace(4, 13, sample_num) x = np.concatenate(([x1], [x2]), axis=0).T y = np.dot(x, np.array([5, 7]).T) return x, y#梯度下降法def SGD(samples, y, step_size=2, max_iter_count=1000): """ :param samples: 樣本 :param y: 結(jié)果value :param step_size: 每一接迭代的步長 :param max_iter_count: 最大的迭代次數(shù) :param batch_size: 隨機(jī)選取的相對于總樣本的大小 :return: """ #確定樣本數(shù)量以及變量的個數(shù)初始化theta值 m, var = samples.shape theta = np.zeros(2) y = y.flatten() #進(jìn)入循環(huán)內(nèi) loss = 1 iter_count = 0 iter_list=[] loss_list=[] theta1=[] theta2=[] #當(dāng)損失精度大于0.01且迭代此時小于最大迭代次數(shù)時,進(jìn)行 while loss > 0.01 and iter_count < max_iter_count: loss = 0 #梯度計(jì)算 theta1.append(theta[0]) theta2.append(theta[1]) #樣本維數(shù)下標(biāo) rand1 = np.random.randint(0,m,1) h = np.dot(theta,samples[rand1].T) #關(guān)鍵點(diǎn),只需要一個樣本點(diǎn)來更新權(quán)值 for i in range(len(theta)): theta[i] =theta[i] - step_size*(1/m)*(h - y[rand1])*samples[rand1,i] #計(jì)算總體的損失精度,等于各個樣本損失精度之和 for i in range(m): h = np.dot(theta.T, samples[i]) #每組樣本點(diǎn)損失的精度 every_loss = (1/(var*m))*np.power((h - y[i]), 2) loss = loss + every_loss print("iter_count: ", iter_count, "the loss:", loss) iter_list.append(iter_count) loss_list.append(loss) iter_count += 1 plt.plot(iter_list,loss_list) plt.xlabel("iter") plt.ylabel("loss") plt.show() return theta1,theta2,theta,loss_list def painter3D(theta1,theta2,loss): style.use('ggplot') fig = plt.figure() ax1 = fig.add_subplot(111, projection='3d') x,y,z = theta1,theta2,loss ax1.plot_wireframe(x,y,z, rstride=5, cstride=5) ax1.set_xlabel("theta1") ax1.set_ylabel("theta2") ax1.set_zlabel("loss") plt.show() if __name__ == '__main__': samples, y = get_data() theta1,theta2,theta,loss_list = SGD(samples, y) print(theta) # 會很接近[5, 7] painter3D(theta1,theta2,loss_list)
新聞熱點(diǎn)


疑難解答
圖片精選


