本文實例為大家分享了python matlibplot繪制3D圖形的具體代碼,供大家參考,具體內容如下
1、散點圖使用scatter
from mpl_toolkits.mplot3d import Axes3Dimport numpy as npfrom matplotlib import pyplot as plt# 生成3D示例數據mu_vec1 = np.array([0,0,0]) # 均值向量cov_mat1 = np.array([[1,0,0],[0,1,0],[0,0,1]]) # 協方差矩陣class1_sample = np.random.multivariate_normal(mu_vec1, cov_mat1, 20)class2_sample = np.random.multivariate_normal(mu_vec1 + 1, cov_mat1, 20)class3_sample = np.random.multivariate_normal(mu_vec1 + 2, cov_mat1, 20)# class1_sample.shape -> (20, 3), 20 rows, 3 columnsfig = plt.figure(figsize=(8,8))ax = fig.add_subplot(111, projection='3d')ax.scatter(class1_sample[:,0], class1_sample[:,1], class1_sample[:,2], marker='x', color='blue', s=40, label='class 1')ax.scatter(class2_sample[:,0], class2_sample[:,1], class2_sample[:,2], marker='o', color='green', s=40, label='class 2')ax.scatter(class3_sample[:,0], class3_sample[:,1], class3_sample[:,2], marker='^', color='red', s=40, label='class 3')ax.set_xlabel('variable X')ax.set_ylabel('variable Y')ax.set_zlabel('variable Z')plt.title('3D Scatter Plot')plt.show()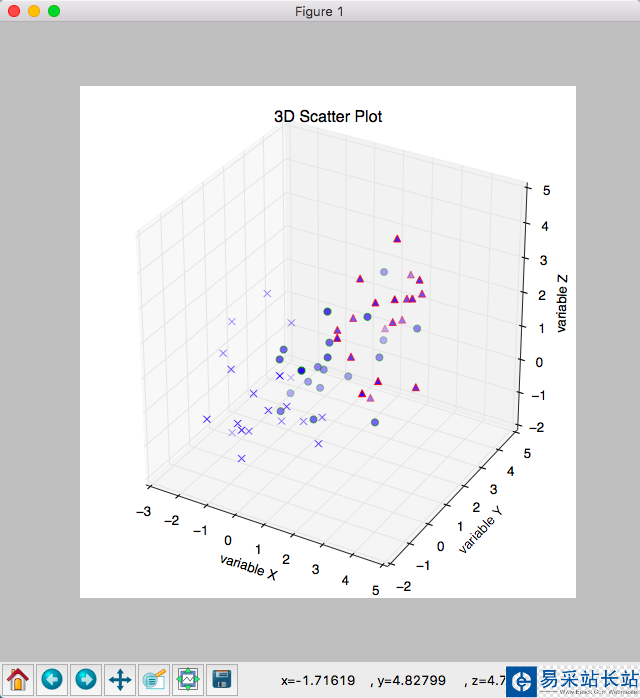
2、直線使用plot3D
from mpl_toolkits.mplot3d import Axes3Dimport matplotlib.pyplot as pltimport numpy as npfrom itertools import product, combinationsfig = plt.figure(figsize=(7,7))ax = fig.gca(projection='3d')ax.set_aspect("equal")# 畫點 # 立方體里的點X_inside = np.array([[0,0,0],[0.2,0.2,0.2],[0.1, -0.1, -0.3]])X_outside = np.array([[-1.2,0.3,-0.3],[0.8,-0.82,-0.9],[1, 0.6, -0.7], [0.8,0.7,0.2],[0.7,-0.8,-0.45],[-0.3, 0.6, 0.9], [0.7,-0.6,-0.8]])for row in X_inside: ax.scatter(row[0], row[1], row[2], color="r", s=50, marker='^')for row in X_outside: ax.scatter(row[0], row[1], row[2], color="k", s=50)# 畫立方體h = [-0.5, 0.5]for s, e in combinations(np.array(list(product(h,h,h))), 2): if np.sum(np.abs(s-e)) == h[1]-h[0]: ax.plot3D(*zip(s,e), color="g")ax.set_xlim(-1.5, 1.5)ax.set_ylim(-1.5, 1.5)ax.set_zlim(-1.5, 1.5)plt.show()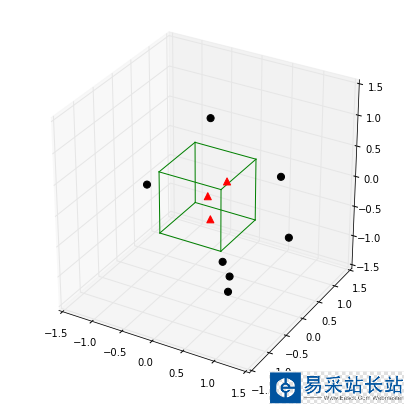
以上就是本文的全部內容,希望對大家的學習有所幫助,也希望大家多多支持武林站長站。
新聞熱點


疑難解答


