iOS Crash常規(guī)跟蹤方法及Bugly集成運(yùn)用
當(dāng)app出現(xiàn)崩潰, 研發(fā)階段一般可以通過(guò)以下方式來(lái)跟蹤crash信息
#1.模擬器運(yùn)行, 查看xcode錯(cuò)誤日志
#2.真機(jī)調(diào)試, 查看xcode錯(cuò)誤日志
#3.真機(jī)運(yùn)行, 查看device系統(tǒng)日志
下面舉例說(shuō)明, 先寫一段會(huì)Crash的代碼crashdemo:
- (void)viewDidLoad { [super viewDidLoad]; // Do any additional setup after loading the view, typically from a nib. [self performSelector:@selector(print) withObject:nil afterDelay:5];}- (void)print { NSArray *array = @[]; NSLog(@"%@", array[1]);}Demo#1.模擬器運(yùn)行, 查看xcode錯(cuò)誤日志
程序執(zhí)行后會(huì)立即崩潰, 打開(kāi)xcode系統(tǒng)日志可以看到以下錯(cuò)誤信息
2016-10-29 12:13:29.015 CrashDemo[37842:7436441] *** Terminating app due to uncaught exception 'NSRangeException', reason: '*** -[__NSArray0 objectAtIndex:]: index 1 beyond bounds for empty NSArray'*** First throw call stack:( 0 CoreFoundation 0x00b7ba84 __exceptionPreprocess + 180 1 libobjc.A.dylib 0x00642e02 objc_exception_throw + 50 2 CoreFoundation 0x00b22390 __CFArrayGetTypeID_block_invoke + 0 3 CoreFoundation 0x00ac07f8 -[NSArray objectAtIndexedSubscript:] + 40 4 CrashDemo 0x000877b7 -[ViewController print] + 87 5 Foundation 0x00250d71 __NSFireDelayedPerform + 442 6 CoreFoundation 0x00acd576 __CFRUNLOOP_IS_CALLING_OUT_TO_A_TIMER_CALLBACK_FUNCTION__ + 22 7 CoreFoundation 0x00accf72 __CFRunLoopDoTimer + 1250 8 CoreFoundation 0x00a8b25a __CFRunLoopRun + 2202 9 CoreFoundation 0x00a8a706 CFRunLoopRunSpecific + 470 10 CoreFoundation 0x00a8a51b CFRunLoopRunInMode + 123 11 GraphicsServices 0x041e4664 GSEventRunModal + 192 12 GraphicsServices 0x041e44a1 GSEventRun + 104 13 UIKit 0x00f0c1eb UIApplicationMain + 160 14 CrashDemo 0x00087bba main + 138 15 libdyld.dylib 0x03189a21 start + 1)libc++abi.dylib: terminating with uncaught exception of type NSException(lldb)
通過(guò)xcode日志可以看到是數(shù)組訪問(wèn)越界, 發(fā)生越界的方式名為print
針對(duì)這個(gè)demo我們當(dāng)然很清楚是剛才列的array[1]發(fā)生越界, 但對(duì)于一個(gè)完整的程序如何查看是在哪個(gè)地方發(fā)生越界的呢?
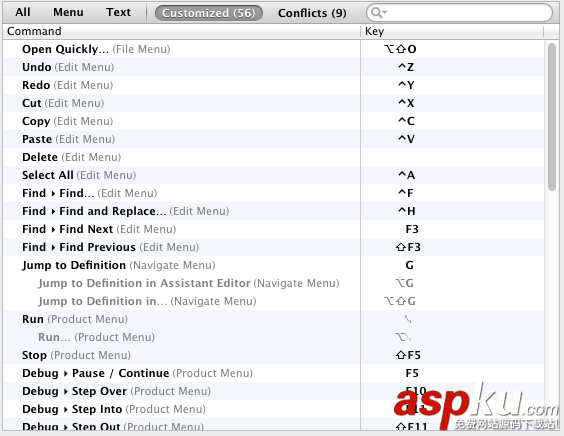
這個(gè)時(shí)候我們可以利用xcode的Show the breakpoint navigator功能, 點(diǎn)加號(hào)選擇add exception breakpoint
這個(gè)時(shí)候我們?cè)趫?zhí)行程序, xcode執(zhí)行會(huì)自動(dòng)停在要發(fā)生crash的代碼段
Demo#2.真機(jī)調(diào)試, 查看xcode錯(cuò)誤日志
如果有添加exeception point, 程序會(huì)自動(dòng)停到打印array[1]那一行. 如果沒(méi)有添加則程序會(huì)crash, xcode會(huì)出現(xiàn)以下錯(cuò)誤日志
2016-10-29 12:15:53.561 CrashDemo[1062:316582] *** Terminating app due to uncaught exception 'NSRangeException', reason: '*** -[__NSArray0 objectAtIndex:]: index 1 beyond bounds for empty NSArray'*** First throw call stack:(0x211b398b 0x2094ee17 0x211433e7 0xc5a3b 0x219d1ad5 0x211765ff 0x21176231 0x2117407d 0x210c32e9 0x210c30d5 0x226b3ac9 0x257880b9 0xc5c99 0x20d6b873)libc++abi.dylib: terminating with uncaught exception of type NSException(lldb)
通過(guò)錯(cuò)誤信息我們只能看到是有發(fā)生數(shù)組訪問(wèn)越界, 如果有添加exeception breakpoint則會(huì)自動(dòng)停在發(fā)生error的代碼行.
Demo#3. 真機(jī)運(yùn)行, 查看device系統(tǒng)日志
xcode停止運(yùn)行這個(gè)crashdemo, 選擇xcode window - devices, 選擇手機(jī) - view device logs
然后在手機(jī)上運(yùn)行crashdemo, 在device logs中按時(shí)間排序查看最新的log就能看到crashdemo的crash log
Incident Identifier: 9A4C52F0-B0D7-42C9-A7CB-D4D3321D00D5CrashReporter Key: 90f4d3621773443794fa73f506fd6bdef49fc269Hardware Model: iPhone4,1Process: CrashDemo [1074]Path: /private/var/containers/Bundle/Application/1307034E-9C2B-451F-ACD9-04C97DEC047B/CrashDemo.app/CrashDemoIdentifier: PEGA.CrashDemoVersion: 1 (1.0)Code Type: ARM (Native)Parent Process: launchd [1]Date/Time: 2016-10-29 12:21:49.49 +0800Launch Time: 2016-10-29 12:21:43.43 +0800OS Version: iOS 9.3.1 (13E238)Report Version: 104Exception Type: EXC_CRASH (SIGABRT)Exception Codes: 0x0000000000000000, 0x0000000000000000Exception Note: EXC_CORPSE_NOTIFYTriggered by Thread: 0Filtered syslog:None foundLast Exception Backtrace:0 CoreFoundation 0x211b3986 __exceptionPreprocess + 1221 libobjc.A.dylib 0x2094ee12 objc_exception_throw + 342 CoreFoundation 0x211433e2 -[__NSArray0 objectAtIndex:] + 1103 CrashDemo 0x000e6a36 0xe0000 + 271904 Foundation 0x219d1ad0 __NSFireDelayedPerform + 4645 CoreFoundation 0x211765fa
這些在開(kāi)發(fā)階段都能很簡(jiǎn)便的實(shí)現(xiàn), 但是當(dāng)app發(fā)布出去后用戶發(fā)生crash呢? 一般用戶只能反饋在做什么的時(shí)候發(fā)生crash
然后我們?cè)谌プ鰢L試是否能遇到, 不過(guò)這樣效率不高而且一般很難復(fù)現(xiàn)到用戶的crash
Bugly的出現(xiàn)解決的這個(gè)問(wèn)題
Bugly SDK在當(dāng)程序崩潰時(shí), 會(huì)自動(dòng)將錯(cuò)誤信息發(fā)送到服務(wù)器方便開(kāi)發(fā)人員查看分析
那么如何使用Bugly?
首先先到https://bugly.qq.com/v2/注冊(cè)賬號(hào), 并注冊(cè)app下載SDK包
將Bugly.framework拖拽到工程中, 記得勾選copy if needed.
然后添加libz.tbd / libstdc++.tbd / Security.framework / SystemConfiguration.framework到工程中
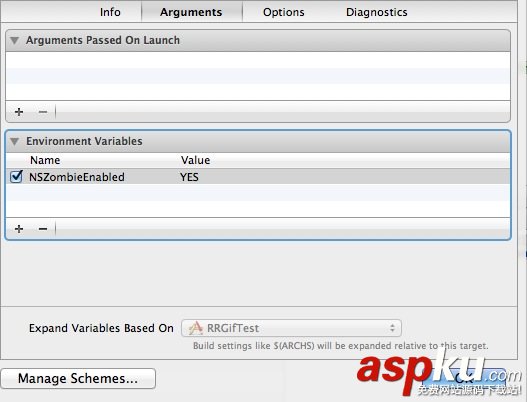
delegate.m中注冊(cè)
- (BOOL)application:(UIApplication *)application didFinishLaunchingWithOptions:(NSDictionary *)launchOptions { [Bugly startWithAppId:@"此處替換為你的AppId"]; return YES; }這樣當(dāng)程序發(fā)生崩潰時(shí), 崩潰信息會(huì)自動(dòng)發(fā)送到服務(wù)器登錄你的bugly賬號(hào)就能查看到了
跟蹤方法及Bugly集成運(yùn)用詳細(xì)介紹")
感謝閱讀,希望能幫助到大家,謝謝大家對(duì)本站的支持!
新聞熱點(diǎn)


疑難解答
圖片精選
網(wǎng)友關(guān)注