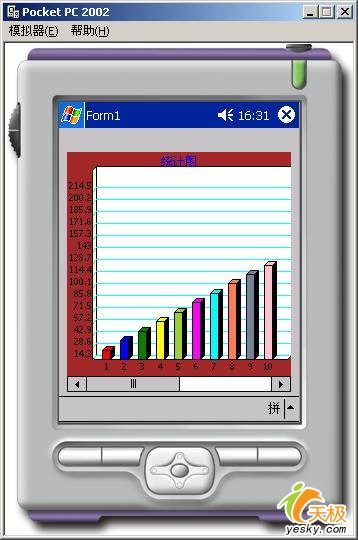
vs.net本身并不提供智能設備(如pda)應用程序的柱形圖,開發智能設備應用程序時vs.net并不象window應用程序那樣提供用戶自定義控件。在本文中,您將創建一個以柱形圖顯示的 pdachartcontrol自定義控件。還將創建一個使用此 pdachartcontrol自定義控件的智能設備應用程序。為了完成開發工作,您將執行這些過程:
· 創建該 pdachartcontrol 自定義控件的運行時版本。
· 編譯該 pdachartcontrol 自定義控件的設計時版本。
· 將該控件添加到工具箱中。
· 創建一個使用該 pdachartcontrol 自定義控件的智能設備應用程序。
· 在智能設備應用程序中測試該控件。
本文的重點不在于編寫控件的代碼,而在于如何創建設計時自定義控件以及如何將它添加到"工具箱"中。
生成自定義控件
第一步是使用智能設備類庫模板創建新項目并生成控件。
創建自定義控件
1. 在"文件"菜單上指向"新建",然后單擊"項目"。
2. 在"新建項目"對話框中的"項目類型"下,單擊"visual c# 項目",并在"模板"下單擊"智能設備應用程序"。
3. 在"名稱"框中,鍵入"pdachartcontrolcontrol",然后單擊"確定"。
4. 在"智能設備應用程序向導"中,單擊上窗格中的"pocket pc"和下窗格中的"類庫",然后單擊"確定"。
創建了一個新項目,class1.cs 在代碼編輯器中打開。
由于已經創建用于該控件的項目,接下來可以向項目中添加引用、更改代碼以及編譯 pdachartcontrol 自定義控件的運行時版本。
編譯自定義控件的運行時版本
1. 在解決方案資源管理器中,右擊 class1.cs 并單擊"重命名"。
2. 重命名文件 pdachartcontrolcontrol.cs。
注意 如果沒有打開解決方案資源管理器,請單擊"視圖"菜單上的"解決方案資源管理器"。
用下列代碼替換 pdachartcontrolcontrol.cs 中的代碼:
//*************************************
// pdachartcontrolcontrol
using system;
using system.collections;
using system.componentmodel;
using system.drawing;
using system.data;
using system.windows.forms;
using system.drawing.drawing2d;
#if netcfdesigntime
[assembly: system.cf.design.runtimeassemblyattribute("pdachartcontrol, version=1.10.0.0, _
culture=neutral, publickeytoken=null")]
namespace pdachartcontrol
{
/// <summary>
/// summary description for usercontrol1.
/// </summary>
public class pdachart : system.windows.forms.control
{
public system.windows.forms.hscrollbar hscrollbar1;
/// <summary>
/// required designer variable.
/// </summary>
// delegate declaration.
// public delegate void eventhandler(string text,color backcolor,int height);
//
// //聲明事件的委托:
// //public delegate void myeventhandler(string text,color backcolor,int height);
// //定義一個公共事件成員
// public event eventhandler addcube;
// protected virtual void onaddcube(eventargs e)
// {
//
// }
//
private pdachartcontrol.mygraph objgraph=new mygraph();
private point mbeginpoint=new point(0,0) ;
private system.componentmodel.container components = null;
public pdachart()
{
initializecomponent();
}
public enum charttypeenum { pillarchart, cakechart ,breaklinkchart};
#region windows 屬性定義
private bool mhscrollbarvisible=true;
#if netcfdesigntime
[system.componentmodel.category("pdachart")]
[system.componentmodel.defaultvalueattribute(0)]
[system.componentmodel.description("設置/讀取滾動條是否可見")]
#endif
public bool hscrollbarvisible
{
get
{
return mhscrollbarvisible;
}
set
{
mhscrollbarvisible =value;
this.invalidate();
}
}
private charttypeenum mcharttype=charttypeenum.pillarchart;
#if netcfdesigntime
[system.componentmodel.category("pdachart")]
[system.componentmodel.defaultvalueattribute(0)]
[system.componentmodel.description("設置/讀取圖形類型")]
#endif
public charttypeenum charttype
{
get
{
return mcharttype;
}
set
{
mcharttype =value;
this.invalidate();
}
}
private int mpicheight=20;
#if netcfdesigntime
[system.componentmodel.category("pdachart")]
[system.componentmodel.defaultvalueattribute(0)]
[system.componentmodel.description("設置/讀取餅圖高")]
#endif
public int picheight
{
get
{
return mpicheight;
}
set
{
mpicheight =value;
this.invalidate();
}
}
private font mtitlefont =new font("arial", 9, fontstyle.regular);
#if netcfdesigntime
[system.componentmodel.category("pdachart")]
[system.componentmodel.description("設置/讀取文本字體")]
#endif
public font titlefont
{
get
{
return mtitlefont;
}
set
{
mtitlefont=value;
this.invalidate();
}
}
private font mtextfont =new font("arial", 8, fontstyle.regular);
#if netcfdesigntime
[system.componentmodel.category("pdachart")]
[system.componentmodel.description("設置/讀取文本字體")]
#endif
public font textfont
{
get
{
return mtextfont;
}
set
{
mtextfont=value;
this.invalidate();
}
}
private static datatable mdatatable=new datatable() ;
#if netcfdesigntime
[system.componentmodel.category("pdachart")]
[system.componentmodel.description("設置/讀取數據表")]
#endif
public datatable datatable
{
get
{
return mdatatable;
}
set
{
mdatatable=(datatable)value;
this.invalidate();
}
}
private string mshowcolumnname;
#if netcfdesigntime
[system.componentmodel.category("pdachart")]
[system.componentmodel.description("設置/讀取顯示列")]
#endif
public string showcolumnname
{
get
{
return mshowcolumnname;
}
set
{
mshowcolumnname=value;
this.invalidate();
}
}
private string mdatacolumnname;
#if netcfdesigntime
[system.componentmodel.category("pdachart")]
[system.componentmodel.description("設置/讀取數據列")]
#endif
public string datacolumnname
{
get
{
return mdatacolumnname;
}
set
{
mdatacolumnname=value;
this.invalidate();
}
}
private string mtitle="統計圖";
#if netcfdesigntime
[system.componentmodel.category("pdachart")]
[system.componentmodel.defaultvalueattribute("圖表")]
[system.componentmodel.description("設置/讀取標題")]
#endif
public string title
{
get
{
return mtitle;
}
set
{
mtitle=value;
this.invalidate();
}
}
private arraylist mcubedata;
#if !netcfdesigntime
//the actual data used to draw the line on the graph
public icollection cubedata
{
get
{
return mcubedata;
}
set
{
mcubedata = new arraylist(value);
rectangle rcclient = this.clientrectangle;
rectangle rcgraphclient = new rectangle(rcclient.x + 21, rcclient.y + 5, rcclient.width - 21, rcclient.height - 21);
this.invalidate(rcgraphclient);
}
}
#endif
private color mbackcolor=system.drawing.systemcolors.controllight;
#if netcfdesigntime
[system.componentmodel.category("pdachart")]
[system.componentmodel.defaultvalueattribute(0)]
[system.componentmodel.description("設置/讀取背景顏色")]
#endif
public override color backcolor
{
get
{
return mbackcolor;
}
set
{
mbackcolor =value;
this.invalidate();
}
}
private color maxesxcolor=system.drawing.systemcolors.highlighttext;
#if netcfdesigntime
[system.componentmodel.category("pdachart")]
[system.componentmodel.defaultvalueattribute(0)]
[system.componentmodel.description("設置/讀取x軸顏色")]
#endif
public color axesxcolor
{
get
{
return maxesxcolor;
}
set
{
maxesxcolor =value;
this.invalidate();
}
}
private color maxesycolor=system.drawing.systemcolors.info;
#if netcfdesigntime
[system.componentmodel.category("pdachart")]
[system.componentmodel.defaultvalueattribute(0)]
[system.componentmodel.description("設置/讀取y軸顏色")]
#endif
public color axesycolor
{
get
{
return maxesycolor;
}
set
{
maxesycolor =value;
this.invalidate();
}
}
private int mlenght = 4;
#if netcfdesigntime
// these design time attributes affect appearance of this property in the property grid.
[system.componentmodel.defaultvalueattribute(5)]
[system.componentmodel.description("立體長")]
#endif
//the lower y bound of the pdachart
public int lenght
{
get
{
return mlenght;
}
set
{
mlenght = value;
this.invalidate();
}
}
private int mmaxyvalue ;//圖表y軸最大值
private int mmaxxvalue ;//圖表x軸最大值
private color mgridlinecolor=system.drawing.color.cyan;
#if netcfdesigntime
[system.componentmodel.category("pdachart")]
[system.componentmodel.description("網格線的顏色.")]
#endif
//the color of the line of the pdachart.
public color gridlinecolor
{
get
{
return mgridlinecolor;
}
set
{
mgridlinecolor =value;
this.invalidate();
}
}
private bool mshowxtext = true;
#if netcfdesigntime
// these design time attributes affect appearance of this property in the property grid.
[system.componentmodel.category("chart")]
[system.componentmodel.defaultvalueattribute(true)]
[system.componentmodel.description("是否顯示x軸的文本")]
#endif
// if true, shows the y-values on the left of the pdachart
public bool isshowxtext
{
get
{
return mshowxtext;
}
set
{
mshowxtext = value;
this.invalidate();
}
}
private bool mshowytext = true;
#if netcfdesigntime
// these design time attributes affect appearance of this property in the property grid.
[system.componentmodel.category("chart")]
[system.componentmodel.defaultvalueattribute(true)]
[system.componentmodel.description("是否顯示y軸的數字")]
#endif
// if true, shows the y-values on the left of the pdachart
public bool isshowytext
{
get
{
return mshowytext;
}
set
{
mshowytext = value;
this.invalidate();
}
}
private bool mshowxscale = true;
#if netcfdesigntime
// these design time attributes affect appearance of this property in the property grid.
[system.componentmodel.category("chart")]
[system.componentmodel.defaultvalueattribute(true)]
[system.componentmodel.description("是否顯示x軸的刻度.")]
#endif
// if true, shows the x-values on the bottom of the pdachart
public bool isshowxscale
{
get
{
return mshowxscale;
}
set
{
mshowxscale = value;
this.invalidate();
}
}
private bool mshowyscale = true;
#if netcfdesigntime
// these design time attributes affect appearance of this property in the property grid.
[system.componentmodel.category("chart")]
[system.componentmodel.defaultvalueattribute(true)]
[system.componentmodel.description("是否顯示y軸的刻度")]
#endif
// if true, shows the y-values on the left of the pdachart
public bool isshowyscale
{
get
{
return mshowyscale;
}
set
{
mshowyscale = value;
this.invalidate();
}
}
private bool mshowgrid = true;
#if netcfdesigntime
// these design time attributes affect appearance of this property in the property grid.
[system.componentmodel.category("chart")]
[system.componentmodel.defaultvalueattribute(false)]
[system.componentmodel.description("是否顯示網格線")]
#endif
// if true, shows horiztonal grid lines on the pdachart.
public bool isshowgrid
{
get
{
return mshowgrid;
}
set
{
mshowgrid = value;
this.invalidate();
}
}
#endregion
/// <summary>
/// clean up any resources being used.
/// </summary>
protected override void dispose( bool disposing )
{
if( disposing )
{
if( components != null )
components.dispose();
}
base.dispose( disposing );
}
#region component designer generated code
/// <summary>
/// required method for designer support - do not modify
/// the contents of this method with the code editor.
/// </summary>
private void initializecomponent()
{
this.paint += new system.windows.forms.painteventhandler(this.onpaint);
this.hscrollbar1 = new system.windows.forms.hscrollbar();
this.hscrollbar1.location = new system.drawing.point(1, 100);
this.hscrollbar1.maximum = 1;
this.hscrollbar1.largechange = 1;
this.hscrollbar1.size = new system.drawing.size(100, 16);
this.hscrollbar1.valuechanged += new system.eventhandler(this.hscrollbar1_valuechanged);
this.controls.add(this.hscrollbar1);
}
#endregion
//
// private arraylist mcudedata;
protected override void onresize(eventargs e)
{
//this.refresh();
}
graphics mgraphics;
pen mblackpen=new pen(color.black);
//偏差
int topheightwarp=16; //頂偏差(文本高)
int leftwidthwarp=0; //左偏差(最大數據文本寬)
int underheightwarp=10; //底偏差(底文本高)
int betweenlineheight=10;//水平線的高
int linecount=10;//水平線數
// //this paint function uses routines common to both platforms.
int clientheight;
int mwidth;
int yheight;
rectangle rcclient;
system.drawing.region region1;
public void onpaint(object sender, system.windows.forms.painteventargs e)
{
//base.paint(null,e);
mgraphics=e.graphics;
//讀取數據
this.rcclient = this.clientrectangle;
region1=new region ( this.rcclient);
region1=region1.clone();
clientheight=rcclient.height;
objgraph.mgraphics=e.graphics; //mgraphics.measurestring//
//計算最大的x軸、y軸坐標
countmaxscalexscaley();
underheightwarp=(int)objgraph.mgraphics.measurestring("文本",this.mtextfont).height+5;
underheightwarp+=this.hscrollbar1.height;
//作圖的范圍區(開始點、長、寬、高)
mbeginpoint.x =this.clientrectangle.x+leftwidthwarp ;
mbeginpoint.y =this.clientrectangle.y+rcclient.height-underheightwarp ;
//寫標題
drawtitle(rcclient);
int width=rcclient.width-this.mlenght-leftwidthwarp;
mwidth=width;
int height=rcclient.height-this.mlenght-topheightwarp-underheightwarp;
this.yheight= height;
int lenght=this.mlenght;
//設置流動條
// this.hscrollbar1.location = new system.drawing.point(0, rcclient.y+rcclient.height);
initpage();
if (this.hscrollbarvisible)
{
this.hscrollbar1.left=0;
this.hscrollbar1.top=rcclient.height-this.hscrollbar1.height ;
this.hscrollbar1.maximum=this.pagecount-1;
if(rcclient.width<246)
this.hscrollbar1.width= rcclient.width;
else
this.hscrollbar1.width=246;
}
else
{
this.hscrollbar1.left=0;
this.hscrollbar1.top=0 ;
}
//從此分別畫圖
if (this.mmaxyvalue>10)
{
//水平網絡線
this.betweenlineheight=(int)objgraph.mgraphics.measurestring("文本",this.mtextfont).height;
this.linecount=height/betweenlineheight;
}
else
{
this.betweenlineheight=height/10;
//線數應該是能整
this.linecount=10;
}
//畫與它父相同背景顏色的區域,以隱藏角邊
color parentbackcolor=color.brown;
objgraph.drawrectangle( parentbackcolor,new point(0,0),rcclient.width,rcclient.height);
e.graphics.drawrectangle(new pen(parentbackcolor), rcclient);
objgraph.drawpdachart(this.mgridlinecolor, this.maxesxcolor,this.maxesycolor,_
this.mbackcolor,mbeginpoint,lenght,width,height, this.mshowxscale,this.mshowyscale);
//畫線和左文本(內部左下點)
point p=mbeginpoint;
p.x+=this.mlenght;
p.y-=this.mlenght;
drawgridlineandtexts(p,width);
//mbeginpoint
//畫矩形與寫文本
//createcubes(mbeginpoint,width,rcclient.height);
//mbeginpoint.x+=10;
createpagecubes(mbeginpoint,width,clientheight);
drawtitle(rcclient);
}
}
//以左下坐標p,顏色color,長lenght,寬width,高height,x軸文本textx,畫立體圖
public void addonecube(string textx,point p,color color,int lenght,int width, int height)
{
try
{
objgraph.drawcube (color,p,lenght,width,height);
//文本
int txtwidth=(int)objgraph.mgraphics.measurestring(textx,mtextfont).width;
int txtheight=(int)objgraph.mgraphics.measurestring(textx,mtextfont).height;
int x=(p.x+width/2)-txtwidth/2;
int y=p.y+txtheight/2;
this.objgraph.drawtext(textx,color.black,this.mtextfont,x,y-5);
}
catch(exception ex)
{
string str=ex.message;
}}
//一頁立方體圖形個數
int onepagecubecount=10;
int currentpage=0;//當前頁
int pagecount=0;//多少頁
//水平軸的相對值
int xscale;
//y軸的相對值
double yscale=0.2;
color[] color={color.red,color.blue,color.green,color.yellow,color.yellowgreen,color.magenta,_
color.cyan,color.coral,color.slategray,color.pink,color.crimson,color.dodgerblue,color.chartreuse };
//計算頁
private void initpage()
{
if(this.onepagecubecount==0) return;
if (mdatatable.rows.count<onepagecubecount)
this.onepagecubecount=mdatatable.rows.count ;
if(this.onepagecubecount==0) return;
pagecount=mdatatable.rows.count/this.onepagecubecount;
//水平軸的相對值
xscale=width/this.onepagecubecount ;
//y軸的相對值
if(this.mmaxyvalue<=0) return;
{
if(this.mmaxyvalue==0) return;
this.yscale=double.parse(this.yheight.tostring())/double.parse( this.mmaxyvalue.tostring() ) ;//system.math.
//this.yscale=double.parse(this.yscale.tostring())/double.parse(this.linecount.tostring() );
}
// this.yscale=double.parse(system.convert.tostring(1))/double.parse( this.mmaxyvalue.tostring() ) ;//system.math.
}
private void hscrollbar1_valuechanged(object sender, system.eventargs e)
{
//onpaint(object sender, system.windows.forms.painteventargs e)
//清畫出的圖
this.currentpage=hscrollbar1.value;
// if (mgraphics.clip==null)
// {
mgraphics=this.creategraphics ();
this.objgraph.mgraphics=mgraphics;
// }
//mgraphics.clip=this.region1;
//畫矩形與寫文本,最多一屏
//mgraphics.clear(this.mbackcolor) ;
//mgraphics.resetclip();
//createpagecubes(mbeginpoint,width,clientheight);
system.windows.forms.painteventargs e1=new painteventargs( mgraphics,this.rcclient);
onpaint(null,e1);
}
public void nextpage()
{
this.objgraph.mgraphics=this.creategraphics ();
this.currentpage++;
bitmap bm = new bitmap(10,10);
graphics g = graphics.fromimage(bm);
if (this.currentpage>this.pagecount)
this.currentpage--;
//畫矩形與寫文本,最多一屏
//mgraphics.clear(color.red) ;
//mgraphics.resetclip();
createpagecubes(mbeginpoint,width,clientheight);
}
//在左下頂點,寬width,高height建立立方體
private void createpagecubes(point beginp ,int width,int height)
{
if(mdatatable.rows.count==0) return;
int between=10;
switch(this.onepagecubecount)
{
case 1:
between= mwidth/2;
break;
case 2:
between= mwidth/3;
break;
case 3:
between= mwidth/4;
break;
case 4:
between= mwidth/5;
break;
case 5:
between= mwidth/6;
break;
case 6:
between= mwidth/7;
break;
case 7:
between= mwidth/8-1;
break;
case 8:
between= mwidth/9-2;
break;
case 9:
between=mwidth/9-5;
break;
case 10:
between=mwidth/10-5;
break;
}
int rowindex=this.onepagecubecount*this.currentpage;
point p=beginp;//dr.
p.x-=8;
for ( int i=0;i<this.onepagecubecount;i++ )
{
//p.x= this.xscale*(i+1)+10;
p.x+=between+this.mlenght;
double cubeheight=this.yscale*system.convert.toint32(mdatatable.rows[rowindex][this.mdatacolumnname]);
//if ((p.x >= 0) && (p.x <= width) && (p.y >= 0) && (p.y <= height))
//{
string text=mdatatable.rows[rowindex][this.mshowcolumnname].tostring() ;
string data=mdatatable.rows[rowindex][this.mdatacolumnname].tostring() ;
int colorindex=rowindex;
if (colorindex>=color.length)
colorindex=color.length-1;
if (this.mshowxtext==false) text=" ";
addonecube(text,p,color[i],this.mlenght,this.mlenght+4,system.convert.toint32(cubeheight));
//}
rowindex++;
}
}
//在左下頂點,寬width,高height建立立方體
private void createcubes(point beginp ,int width,int height)
{
if(mdatatable.rows.count==0) return;
//水平軸的相對值
int xscale=width/mdatatable.rows.count ;
//y軸的相對值
if(this.mmaxyvalue<=0) return;
int yscale=height/(this.mmaxyvalue*this.linecount) ;
int rowindex=0;
color[] color={color.red,color.blue,color.green,color.yellow,color.yellowgreen,color.magenta,_
color.cyan,color.coral,color.slategray,color.pink,color.crimson,color.dodgerblue,color.chartreuse };
foreach(datarow dr in mdatatable.rows)
{
rowindex+=1;
point p=beginp;//dr.
p.x= xscale*rowindex+10;
int cubeheight=yscale*system.convert.toint32(dr[this.mdatacolumnname]);
if ((p.x >= 0) && (p.x <= width) && (p.y >= 0) && (p.y <= height))
{
string text=dr[this.mshowcolumnname].tostring() ;
string data=dr[this.mdatacolumnname].tostring() ;
int colorindex=rowindex;
if (colorindex>=color.length)
colorindex=color.length-1;
if (this.mshowxtext==false) text=" ";
addonecube(text,p,color[colorindex-1],this.mlenght,this.mlenght+5,cubeheight);
//objgraph.drawcube (color,p,this.mlenght,width,height);
}
}
}
//計算最大的x、y軸坐標,左邊文本寬,最小的線高
private void countmaxscalexscaley()
{
if(mdatatable.rows.count==0) return;
this.mmaxxvalue=mdatatable.rows.count ;
this.mmaxyvalue=0;
//this.l.
foreach(datarow dr in mdatatable.rows)
{
int cubeheight=system.convert.toint32(dr[this.mdatacolumnname]);
if (mmaxyvalue<cubeheight)
{
mmaxyvalue=cubeheight;
}
int textwidth=(int)objgraph.mgraphics.measurestring(system.convert.todouble( dr[this.mdatacolumnname])._
tostring() ,this.mtextfont).width+10;
if (leftwidthwarp<textwidth)
{
leftwidthwarp=textwidth;
}
}
//leftwidthwarp+=10;
}
//在頂部中心位置寫標題
private void drawtitle(rectangle rcclient)
{
int width=(int)objgraph.mgraphics.measurestring(this.mtitle,mtitlefont).width;
int height=(int)objgraph.mgraphics.measurestring(this.mtitle,mtitlefont).height;
this.topheightwarp=height;
int x=rcclient.width/2- width/2;
int y=rcclient.y+height/2-5;
this.objgraph.drawtext(this.mtitle,color.blue,mtitlefont,x,y);
}
//畫所有水平網絡線
//p:起始點;width:線寬;betweenheight:二線之間高,count:線數
// private void drawgridlineandtexts(point p,int width)
// {
// for(int i=0;i<this.linecount;i++)
// {
// drawgridlineandtext(p,p,width,lenght);
// p.y-=betweenheight;
// }
// }
//由頂點與長、寬、高畫顏色為color,背景色為的backcolor圖表(3d)
private void drawgridlineandtexts(point p,int width)
{//是否顯示網絡水平線
if (this.mshowgrid)
{
this.objgraph.drawgridlines(this.mgridlinecolor,p,width-1,this.mlenght,this.betweenlineheight,this.linecount);
}
//是否顯示左文本
if (this.mshowytext)
{
point p1=p;
//p1.x-=this.mlenght;
p1.y+=lenght;
double a1=double.parse(system.convert.tostring(this.linecount-1));
double a2=double.parse(this.mmaxyvalue.tostring());
double a=system.math.round(a2/a1,1);
for(int i=0;i<this.linecount;i++)
{
string text=system.convert.tostring(a*(i+1));
int txtwidth=(int)objgraph.mgraphics.measurestring(text,this.mtextfont).width;
p1.x=p.x-txtwidth-this.mlenght;;
p1.y-=this.betweenlineheight;
this.objgraph.drawtext(text,color.black,this.mtextfont,p1.x,p1.y);
}
}
}
//求數據列的和
private double sumcolumn(datatable dt,string columnname)
{
double sum=0.0;
foreach(datarow dr in dt.rows)
{
sum+=system.convert.todouble(dr[columnname]);
}
return sum;
}
}
#region
public class mygraph
{
//網絡水平線中二線之間的高
//int betweenlineheight=20;
//最大maxycount:線數
// int maximumy=10;
// int lenght=5;
// int width=200;
// int height=300;
// bool isshowgrid=true;
public graphics mgraphics;
//背景色
// public color backcolor= system.drawing.systemcolors.control;
// //x軸顏色
// public color axesxcolor=system.drawing.systemcolors.highlighttext;
// //y軸顏色
// public color axesycolor=system.drawing.systemcolors.info;
//黑色筆
private pen mblackpen = new system.drawing.pen(color.fromargb(0,0,0));
//網格線筆
private pen mgridpen= new system.drawing.pen(color.fromargb(127, 127, 127));
//color backcolor= system.drawing.color.fromargb(((system.byte)(224)), ((system.byte)(224)), ((system.byte)(224)));
public mygraph()
{
//mgraphics=this.creategraphics(); //
// todo: 在此處添加構造函數邏輯
//
}
//由左下頂點與寬、高畫顏色為color的平行四邊形
public void drawrectangle3dtop(color color, point leftunderpoint,int width,int height)
{
try
{
//計算左上頂點
point p1=new point ();
p1.x=leftunderpoint.x+height;
p1.y=leftunderpoint.y-height;
//計算右上頂點
point p2=new point ();
p2.x=leftunderpoint.x+width+height;
p2.y=leftunderpoint.y-height;
//計算右下頂點
point p3=new point ();
p3.x=leftunderpoint.x+width;
p3.y=leftunderpoint.y;
point[] curvepoints =
{
leftunderpoint,
p1,
p2,
p3
};
// define fill mode.
//fillmode newfillmode = fillmode.winding;
// fill polygon to screen.
// create solid brush.
solidbrush brush = new solidbrush(color);
mgraphics.fillpolygon(brush, curvepoints);
//mgraphics.fillpolygon(brush, curvepoints, newfillmode);
//畫邊框
mgraphics.drawpolygon(this.mblackpen, curvepoints);
}
catch(exception ex)
{
string str=ex.message;
}
}
//由左下頂點與寬、高畫顏色為color的平等四邊形
public void drawrectangle3dright(color color, point leftunderpoint,int width,int height)
{
try
{
// create solid brush.
solidbrush brush = new solidbrush(color);
//計算左上頂點
point p1=new point ();
p1.x=leftunderpoint.x;
p1.y=leftunderpoint.y-height;
//計算右上頂點
point p2=new point ();
p2.x=p1.x+width;
p2.y=p1.y-width;
//計算右下頂點
point p3=new point ();
p3.x=leftunderpoint.x+width;
p3.y=leftunderpoint.y-width;
point[] curvepoints =
{
leftunderpoint,
p1,
p2,
p3
};
// define fill mode.
//fillmode newfillmode = fillmode.winding;
// fill polygon to screen.
mgraphics.fillpolygon(brush, curvepoints);
//畫邊框
mgraphics.drawpolygon(this.mblackpen, curvepoints);
//mgraphics.fillpolygon(brush, curvepoints, newfillmode);
}
catch(exception ex)
{
string str=ex.message;
}
}
//由左上角頂點與寬、高畫顏色為color的平行四邊形
public void drawrectangle(color color, point p,int width,int height)
{
rectangle rectangle1=new rectangle( p.x,p.y, width,height);
// create solid brush.
solidbrush brush = new solidbrush(color);
// fill polygon to screen.
mgraphics.fillrectangle(brush, rectangle1);
//畫邊框
mgraphics.drawrectangle(this.mblackpen,rectangle1);
}
//由左下頂點與長、寬、高畫顏色為color的立方圖形(3d)
public void drawcube(color color, point leftunderpoint,int lenght,int width,int height)
{
// create solid brush.
solidbrush brush = new solidbrush(color);
point lefttoppoint= leftunderpoint;
lefttoppoint.y-= height;
drawrectangle3dtop(color,lefttoppoint,width,lenght);
drawrectangle(color,lefttoppoint,width,height);
point rightp=leftunderpoint;
rightp.x+=width;
drawrectangle3dright(color.black,rightp,lenght,height);
}
//畫x軸
public void drawaxesx(color color, point p,int width,int height)
{
drawrectangle3dtop(color,p,width,height);
}
//畫y軸
public void drawaxesy(color color, point p,int width,int height)
{
drawrectangle3dright(color,p,width,height);
}
//由頂點與長、寬、高畫顏色為color,背景色為的backcolor圖表(3d)
public void drawpdachart(color gridlinecolor,color axesxcolor,color axesycolor,_
color backcolor,point p,int lenght,int width,int height,bool isshowaxesx,bool isshowaxesy)
{
if(isshowaxesx)
{
//畫x軸
drawaxesx(axesxcolor,p,width,lenght);
}
if(isshowaxesy)
{
//畫y軸
drawaxesy(axesycolor,p,lenght,height);
}
////畫圖形區
point prectangle=p;
prectangle.x+=lenght;
prectangle.y-=lenght;
prectangle.y-=height;
drawrectangle(backcolor,prectangle,width,height);
}
//畫一條水平網絡線與對應的折線
public void drawgridline(color gridlinecolor,point p,int width,int lenght)
{
//draw the y scale;
point endp=p;
endp.x+=width;
pen pen=new pen( gridlinecolor);
//this.mgraphics.drawline(pen,p,endp);
//水平線
this.mgraphics.drawline(pen,p.x,p.y,endp.x,endp.y );
//左折線
this.mgraphics.drawline(pen,p.x,p.y,endp.x-lenght,endp.y+lenght );
}
//畫所有水平網絡線
//p:起始點;width:線寬;betweenheight:二線之間高,count:線數
public void drawgridlines(color gridlinecolor,point p,int width,int lenght,int betweenheight,int count)
{
pen pen=new pen( gridlinecolor);
for(int i=0;i<count;i++)
{
//drawgridline(gridlinecolor,p,width,lenght);
//水平線
this.mgraphics.drawline(pen,p.x,p.y,p.x+width,p.y );
//左折線
this.mgraphics.drawline(pen,p.x-lenght+1,p.y+lenght,p.x,p.y);
p.y-=betweenheight;
}
}
//在位置(x,y)處以顏色color、字體font寫文本text
public void drawtext(string text,color color, font font,int x,int y)
{
// create solid brush.
solidbrush brush = new solidbrush(color);
this.mgraphics.drawstring(text, font, brush, x ,y);
}
//由點p(矩形左上角點),寬piewidth,高pieheight,顏色color畫餡餅圖
public void drawcake(color color,point p,int piewidth,int pielenght,int pieheight)
{
pen penblack=new pen( color.black);
//黑色最下面的橢圓
rectangle rc1 =new rectangle(p.x,p.y+pieheight,piewidth,pielenght);
this.mgraphics.drawellipse(penblack,rc1);
solidbrush objbrush = new solidbrush(color);
for(int i=0;i<pieheight;i++)
{
this.mgraphics.fillellipse(objbrush,p.x,p.y+i,piewidth,pielenght);
}
//黑色最上面的橢圓
rectangle rc =new rectangle(p.x,p.y,piewidth,pielenght);
this.mgraphics.drawellipse(penblack,rc);
this.mgraphics.drawline( penblack,p.x,p.y+pielenght/2,p.x,p.y+pieheight+pielenght/2);
this.mgraphics.drawline( penblack,p.x+piewidth,p.y+pielenght/2,p.x+piewidth,p.y+pieheight+pielenght/2);
}
//求隋圓任意一點x坐標的相對點
//角angle,中心點opoint,a,長半軸,b,短半軸
public double getellipsepx(double angle,int a,int b)
{
//角
double radians = angle * (math.pi/180);
double px=a*system.math.cos(radians) ;
return px;
}
//求隋圓任意一點y坐標的相對點
//角angle,中心點opoint,a,長半軸,b,短半軸
public double getellipsepy(double angle,int a,int b)
{
//角
double radians = angle * (math.pi/180);
double py=b*system.math.sin(radians);
return py;
}
//畫線橢圓線
//角angle,中心點opoint,a,長半軸,b,短半軸
public void drawellipseline(double angle,point opoint,int a,int b)
{
int px=system.convert.toint32(getellipsepx(angle,a,b))+opoint.x ;
int py=system.convert.toint32(getellipsepy(angle,a,b))+opoint.y ;
pen penblack=new pen( color.black);
this.mgraphics.drawline( penblack,opoint.x,opoint.y,px,py);
//e.graphics.drawline( penblack,opoint.x,opoint.y,opoint.x+b,opoint.y);
}
//取扇形的點集(逆時針)
//角angle,已經畫過的角finishangle,中心點opoint,長半軸a,短半軸b
public arraylist getpicpoints(double angle,double finishangle,point opoint,int a,int b)
{
//point[system.convert.toint32(angle)] curvepoints=new array() ;
//以步長為1求扇形弧線的坐標點
arraylist plist=new arraylist() ;
plist.add(opoint);
//plist.add(arcstartpoint);
for(int i=0;i<system.convert.toint32(angle);i++)
{
int px=system.convert.toint32(getellipsepx(i+finishangle,a,b))+opoint.x ;
int py=system.convert.toint32(getellipsepy(i+finishangle,a,b))+opoint.y ;
plist.add(new point(px,py));
//curvepoints.setvalue(
}
return plist;
}
//畫扇形(逆時針)
//角度angle,已經畫過的角finishangle,中心點opoint,長半軸a,短半軸b
public void drawpdapic(color color, string text,double angle,double finishangle,point opoint,int a,int b)
{
// create solid brush.
solidbrush brush = new solidbrush(color);
arraylist plist=getpicpoints(angle,finishangle,opoint,a,b);
point[] curvepoints=new point[plist.count] ;
for(int i=0;i<plist.count;i++)
curvepoints[i]=(point)plist[i];
mgraphics.fillpolygon(brush, curvepoints);
//畫邊框
mgraphics.drawpolygon(this.mblackpen, curvepoints);
//drawtext(text,color.black,this.
}
}
#endregion
3. 在解決方案資源管理器中,右擊"引用",然后單擊"添加引用"。
4. 在"添加引用"對話框中的".net"選項卡上,單擊"system.drawing",然后單擊"選擇"。
"system.drawing"會出現在"選定的組件"下。
5. 對"system.windows.forms"重復步驟 4 并單擊"確定"。
"system.drawing"和"system.windows.forms"都會出現在解決方案資源管理器的"引用"下。
6. 在"生成"菜單上,單擊"生成解決方案"。
將生成控件 pdachartcontrolcontrol.dll 的運行時版本并將其放在目錄 projects_directory/pdachartcontrolcontro/bin/debug/ 中。
7. 在"文件"菜單中,單擊"關閉解決方案"。
由于生成了控件的運行時版本,接下來可以為設計器支持生成設計時版本。
生成自定義控件的設計時版本
1. 打開 visual studio .net 命令提示。
注意 要打開 visual studio .net 命令提示,請單擊"開始",再依次指向"程序"、"microsoft visual studio .net 2003"和"visual studio .net 工具",然后單擊"visual studio .net 命令提示"。
2. 切換到包含 pdachartcontrolcontrol.cs 的目錄。
3. 在命令提示處鍵入以下內容:
csc /noconfig /define:netcfdesigntime /target:library /out:design.pdachartcontrolcontrol.dll pdachartcontrolcontrol.cs /r:"c:/program files/microsoft visual studio .net 2003/compactframeworksdk/v1.0.5000/windows ce/designer/system.cf.design.dll" /r:"c:/program files/microsoft visual studio .net 2003/compactframeworksdk/v1.0.5000/windows ce/designer/system.cf.windows.forms.dll" /r:"c:/program files/microsoft visual studio .net 2003/compactframeworksdk/v1.0.5000/windows ce/designer/system.cf.drawing.dll" /r:system.windows.forms.dll /r:system.drawing.dll /r:system.dll /r:system.xml.dll /r:system.web.services.dll /r:system.data.dll /nowarn:1595
這將生成自定義控件的設計時版本。文件 design.pdachartcontrolcontrol.dll 放置在當前目錄中。
將自定義控件添加到工具箱
由于編譯了控件的運行時和設計時版本,接下來可以將該控件添加到"工具箱",并在智能設備應用程序中使用它了。
將自定義控件添加到"工具箱" 的步驟:
1. 將文件 design.pdachartcontrolcontrol.dll 復制到目錄 program files/microsoft visual studio .net 2003/compactframeworksdk/v1.0.5000/windows ce/designer 中。
2. 將文件 pdachartcontrolcontrol.dll 復制到目錄 program files/microsoft visual studio .net 2003/compactframeworksdk/v1.0.5000/windows ce 中。
3. 在"視圖"菜單上單擊"工具箱"。
4. 右擊"常規",然后單擊"顯示所有選項卡"。
5. 單擊"設備控件"以顯示設備上可用控件的完整列表。
6. 右擊"指針",然后單擊"添加/移除項"。
7. 在"自定義工具箱"對話框的".net framework 組件"選項卡上,單擊"瀏覽"。
8. 選擇"design.pdachartcontrolcontrol.dll"并單擊"打開",將"pdachartcontrol"控件添加到"自定義工具箱"對話框中的組件列表。
9. 在 .net framework 組件列表中選擇"pdachartcontrol"控件,然后單擊"確定"。
"pdachartcontrol"控件即被添加到"工具箱"中。
測試自定義控件
由于自定義控件出現在"工具箱"中,接下來可以使用 windows 窗體設計器將它拖到窗體上。
將自定義控件添加到窗體
1. 在"文件"菜單上指向"新建",然后單擊"項目"。
2. 在"新建項目"對話框中的"項目類型"下,單擊"visual c# 項目",并在"模板"下單擊"智能設備應用程序"。
3. 在"名稱"框中,鍵入"pdachartcontrolcontroltest",然后單擊"確定"。
4. 在"智能設備應用程序向導"中,單擊上窗格中的"pocket pc"和下窗格中的"windows 應用程序",然后單擊"確定"。
創建了新項目,form1.cs 在設計器中打開。
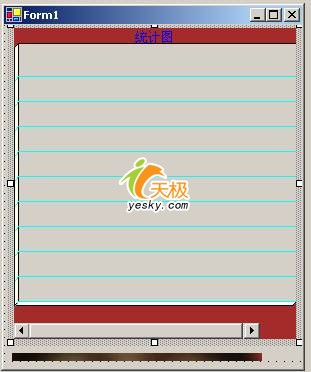
5. 從工具箱將"pdachartcontrol"控件拖到窗體上。
自定義控件即被添加到窗體上,指向 pdachartcontrolcontrol 的引用則被添加到項目中。
注意 如果工具箱不可見,則在"查看"菜單上,單擊"工具箱"。
自動生成的代碼如下:
pdachartcontrol.pdachart mygraph=new pdachartcontrol.pdachart();
this.pdachart1.axesxcolor = system.drawing.systemcolors.highlighttext;
this.pdachart1.axesycolor = system.drawing.systemcolors.info;
this.pdachart1.backcolor = system.drawing.systemcolors.controllight;
this.pdachart1.charttype = pdachartcontrol.pdachart.charttypeenum.cakechart;
this.pdachart1.datacolumnname = "dataid";
this.pdachart1.gridlinecolor = system.drawing.color.cyan;
this.pdachart1.hscrollbarvisible = true;
this.pdachart1.isshowgrid = true;
this.pdachart1.location = new system.drawing.point(8, 24);
this.pdachart1.picheight = 20;
this.pdachart1.showcolumnname = "showid";
this.pdachart1.size = new system.drawing.size(224, 240);
this.pdachart1.text = "pdachart1";
this.pdachart1.textfont = new system.drawing.font("arial", 8f, system.drawing.fontstyle.regular);
this.pdachart1.title = "統計圖";
this.pdachart1.titlefont = new system.drawing.font("arial", 9f, system.drawing.fontstyle.regular);
this.pdachart1.hscrollbar1.visible=false;
this.controls.add(this.pdachart1);
6. 生成測試數據
//測試數據
this.pdachart1.datatable=createquerytable();
this.pdachart1.datacolumnname= "dataid";
this.pdachart1.showcolumnname= "showid";
//建立查詢明細表
private datatable createquerytable()
{
datatable dt=new datatable("query");
dt.columns.add("dataid");
dt.columns.add("showid");
for(int i=0;i<10;i++)
{
datarow dr=dt.newrow();
dr["dataid"]=(i+1)*10;
dr["showid"]=(i+1).tostring() ;
dt.rows.add(dr);
}
return dt;
}
7. 在"設備"工具欄的"部署設備"框中,選擇要用作目標的設備。
8. 在"調試"菜單上單擊"開始執行(不調試)"。
編譯該應用程序并將其部署到目標設備上(與運行時所需的任何其他庫一起),然后在設備上啟動該應用程序。
執行結果如下: