使用matplotlib中的一些函數將tensorflow中的數據可視化,更加便于分析
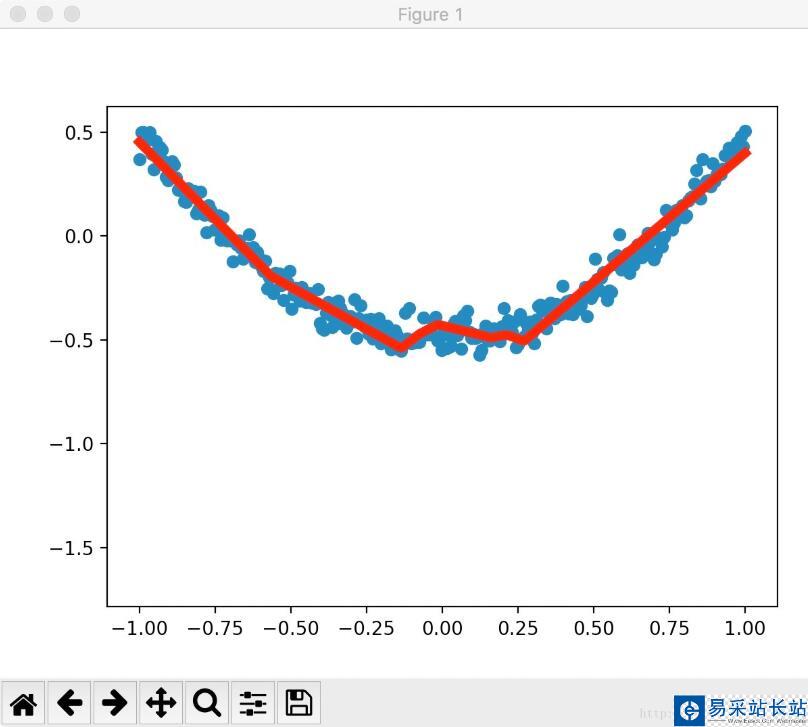
import tensorflow as tfimport numpy as npimport matplotlib.pyplot as pltdef add_layer(inputs, in_size, out_size, activation_function=None): Weights = tf.Variable(tf.random_normal([in_size, out_size])) biases = tf.Variable(tf.zeros([1, out_size]) + 0.1) Wx_plus_b = tf.matmul(inputs, Weights) + biases if activation_function is None: outputs = Wx_plus_b else: outputs = activation_function(Wx_plus_b) return outputs# Make up some real datax_data = np.linspace(-1, 1, 300)[:, np.newaxis]noise = np.random.normal(0, 0.05, x_data.shape)y_data = np.square(x_data) - 0.5 + noise# define placeholder for inputs to networkxs = tf.placeholder(tf.float32, [None, 1])ys = tf.placeholder(tf.float32, [None, 1])# add hidden layerl1 = add_layer(xs, 1, 10, activation_function=tf.nn.relu)# add output layerprediction = add_layer(l1, 10, 1, activation_function=None)# the error between prediction and real dataloss = tf.reduce_mean(tf.reduce_sum(tf.square(ys-prediction), reduction_indices=[1]))train_step = tf.train.GradientDescentOptimizer(0.1).minimize(loss)# important step#initialize_all_variables已被棄用,使用tf.global_variables_initializer代替。 init = tf.global_variables_initializer()sess = tf.Session()sess.run(init)# plot the real datafig = plt.figure()ax = fig.add_subplot(1,1,1)ax.scatter(x_data, y_data)plt.ion() #使plt不會在show之后停止而是繼續運行plt.show()for i in range(1000): # training sess.run(train_step, feed_dict={xs: x_data, ys: y_data}) if i % 50 == 0: # to visualize the result and improvement try: ax.lines.remove(lines[0]) #在每一次繪圖之前先講上一次繪圖刪除,使得畫面更加清晰 except Exception: pass prediction_value = sess.run(prediction, feed_dict={xs: x_data}) # plot the prediction lines = ax.plot(x_data, prediction_value, 'r-', lw=5) #'r-'指繪制一個紅色的線 plt.pause(1) #指等待一秒鐘運行結果如下:(實際效果應該是動態的,應當使用ipython運行,使用jupyter運行則圖片不是動態的)
注意:initialize_all_variables已被棄用,使用tf.global_variables_initializer代替。
以上這篇通過python的matplotlib包將Tensorflow數據進行可視化的方法就是小編分享給大家的全部內容了,希望能給大家一個參考,也希望大家多多支持武林站長站。
新聞熱點


疑難解答


