今天使用python畫了幾個好玩的3D展示圖,現在分享給大家。
先貼上圖片
使用的python工具包為:
from matplotlib import pyplot as pltimport numpy as npfrom mpl_toolkits.mplot3d import Axes3D
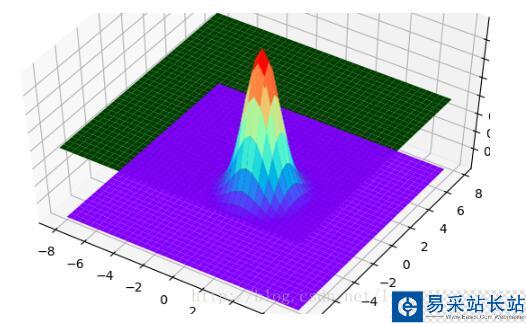
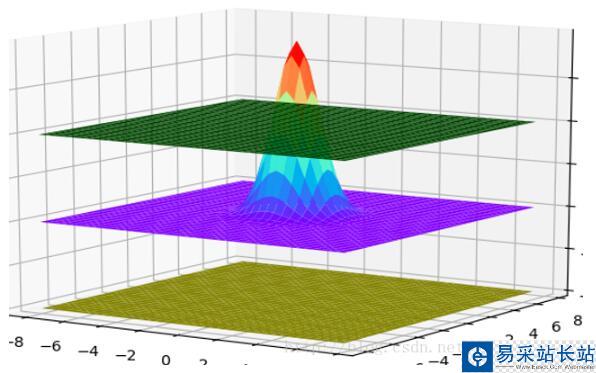
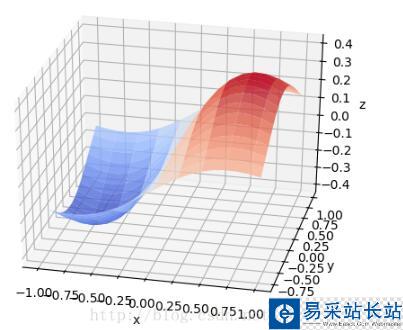
在貼代碼之前,有必要從整體上了解這些圖是如何畫出來的。可以把上面每一個3D圖片理解成一個長方體。輸入數據是三維的,x軸y軸和z軸。在第三個圖片里面有x、y和z坐標的標識。在第三張圖片中,我們可以理解為,z是隨著x和y變化的函數。就像一個人在山丘地區走動一樣,其中x和y表示的是方向,z表示的這個人在上坡還是下坡。第二張圖片的中間那個,其實是一個3維的正態分布圖。
具體的公式為:
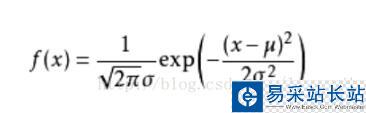
上面的是2維的,即只有x和y,如果是三維的話,需要一點變形,只需要在上面的公式基礎之上把exp()里面改變為:exp(-((x-u)^2 + (y - u)^2)/(2q^2)), 這里的u表示平均值,q表示標準差。這樣變化之后,z = f(x, y)。這就是z值的公式了,表示的是z值隨著x和y值的變化而變化的函數。
下面貼一下代碼
這是第二張圖片的代碼。
from matplotlib import pyplot as pltimport numpy as npfrom mpl_toolkits.mplot3d import Axes3Dfig = plt.figure()ax = Axes3D(fig)len = 8;step = 0.4;def build_layer(z_value): x = np.arange(-len, len, step); y = np.arange(-len, len, step); z1 = np.full(x.size, z_value/2) z2 = np.full(x.size, z_value/2) z1, z2 = np.meshgrid(z1, z2) z = z1 + z2; x, y = np.meshgrid(x, y) return (x, y, z);def build_gaussian_layer(mean, standard_deviation): x = np.arange(-len, len, step); y = np.arange(-len, len, step); x, y = np.meshgrid(x, y); z = np.exp(-((y-mean)**2 + (x - mean)**2)/(2*(standard_deviation**2))) z = z/(np.sqrt(2*np.pi)*standard_deviation); return (x, y, z);# 具體函數方法可用 help(function) 查看,如:help(ax.plot_surface)x1, y1, z1 = build_layer(0.2);ax.plot_surface(x1, y1, z1, rstride=1, cstride=1, color='green')x5, y5, z5 = build_layer(0.15);ax.plot_surface(x5, y5, z5, rstride=1, cstride=1, color='pink')# x2, y2, z2 = build_layer(-0.26);# ax.plot_surface(x2, y2, z2, rstride=1, cstride=1, color='yellow')## x6, y6, z6 = build_layer(-0.22);# ax.plot_surface(x6, y6, z6, rstride=1, cstride=1, color='pink')# x4, y4, z4 = build_layer(0);# ax.plot_surface(x4, y4, z4, rstride=1, cstride=1, color='purple')x3, y3, z3 = build_gaussian_layer(0, 1)ax.plot_surface(x3, y3, z3, rstride=1, cstride=1, cmap='rainbow')plt.show()這是第三張圖片的代碼import numpy as npimport matplotlib.pyplot as pltimport mpl_toolkits.mplot3dx, y = np.mgrid[-1:1:20j, -1:1:20j]z = x * np.exp(-x ** 2 - y ** 2)ax = plt.subplot(111, projection='3d')ax.plot_surface(x, y, z, rstride=2, cstride=1, cmap=plt.cm.coolwarm, alpha=0.8)ax.set_xlabel('x')ax.set_ylabel('y')ax.set_zlabel('z')plt.show()
新聞熱點


疑難解答


